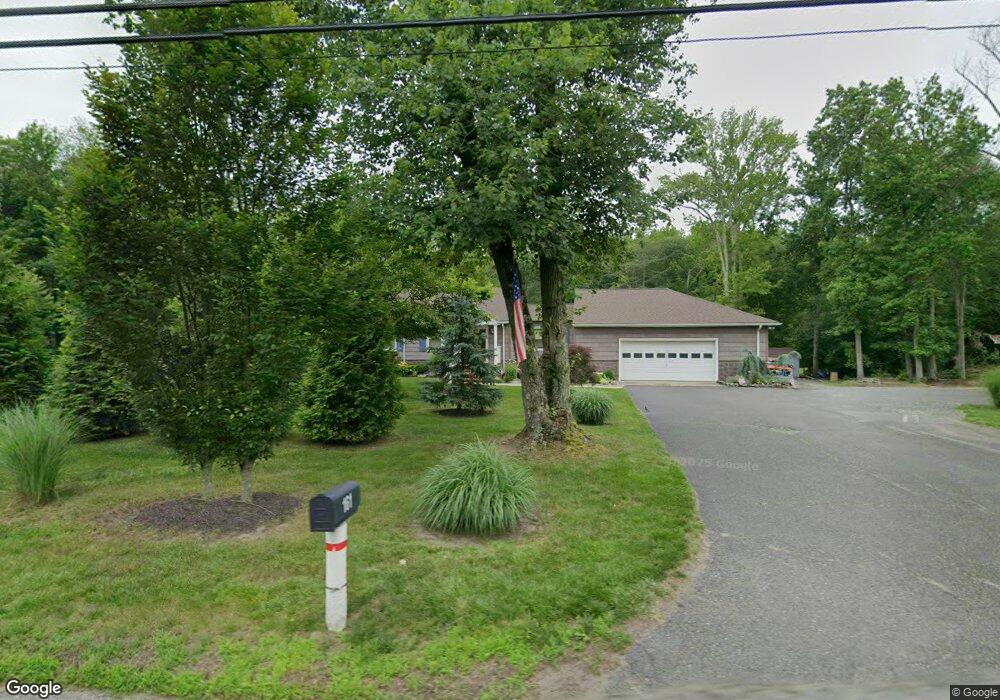
161 Squankum Yellowbrook Rd Farmingdale, NJ 07727
East Howell NeighborhoodEstimated Value: $564,000 - $735,000
2
Beds
1
Bath
1,464
Sq Ft
$427/Sq Ft
Est. Value
About This Home
This home is located at 161 Squankum Yellowbrook Rd, Farmingdale, NJ 07727 and is currently estimated at $624,895, approximately $426 per square foot. 161 Squankum Yellowbrook Rd is a home located in Monmouth County with nearby schools including Ardena School, Adelphia Elementary School, and Howell Middle School North.
Ownership History
Date
Name
Owned For
Owner Type
Purchase Details
Closed on
Dec 21, 2016
Sold by
Olson Arthur R and Olson Jo Ann
Bought by
Fallon Colin and Fallon Melinda
Current Estimated Value
Home Financials for this Owner
Home Financials are based on the most recent Mortgage that was taken out on this home.
Original Mortgage
$343,151
Outstanding Balance
$284,347
Interest Rate
4.4%
Mortgage Type
FHA
Estimated Equity
$340,548
Create a Home Valuation Report for This Property
The Home Valuation Report is an in-depth analysis detailing your home's value as well as a comparison with similar homes in the area
Home Values in the Area
Average Home Value in this Area
Purchase History
| Date | Buyer | Sale Price | Title Company |
|---|---|---|---|
| Fallon Colin | $355,000 | Anchor Title Agency |
Source: Public Records
Mortgage History
| Date | Status | Borrower | Loan Amount |
|---|---|---|---|
| Open | Fallon Colin | $343,151 |
Source: Public Records
Tax History Compared to Growth
Tax History
| Year | Tax Paid | Tax Assessment Tax Assessment Total Assessment is a certain percentage of the fair market value that is determined by local assessors to be the total taxable value of land and additions on the property. | Land | Improvement |
|---|---|---|---|---|
| 2025 | $9,029 | $466,300 | $194,900 | $271,400 |
| 2024 | $8,998 | $452,600 | $186,200 | $266,400 |
| 2023 | $8,998 | $429,500 | $169,300 | $260,200 |
| 2022 | $6,598 | $392,400 | $144,600 | $247,800 |
| 2021 | $6,598 | $352,500 | $144,600 | $207,900 |
| 2020 | $8,829 | $350,200 | $144,600 | $205,600 |
| 2019 | $8,865 | $346,700 | $144,600 | $202,100 |
| 2018 | $8,685 | $337,300 | $144,600 | $192,700 |
| 2017 | $7,327 | $281,700 | $134,100 | $147,600 |
| 2016 | $7,090 | $270,100 | $126,300 | $143,800 |
| 2015 | $7,118 | $266,400 | $126,300 | $140,100 |
| 2014 | $7,040 | $244,700 | $133,300 | $111,400 |
Source: Public Records
Map
Nearby Homes
- 156 Old Tavern Rd
- 6 New Castle St
- 465 Lakewood Farmingdale Rd
- 101 Main St
- 175 Birdsall Rd
- 73 Maxim Rd
- 67 Maxim Rd
- 14 Maxim Rd
- 51 Asbury Rd
- 9 Us Highway 9
- 1 Ethan Dr
- 1574 Maxim Southard Rd
- 251 Oak Glen Rd
- 28 Brent Dr
- 51 Casino Dr
- 17 Cherry Bend Dr
- 62 Appletree Rd
- 26 Sweetbriar Trail
- 67 Appletree Rd
- 60 N Main St
- 160 Squankum Yellowbrook Rd
- 175 Squankum Yellowbrook Rd
- 175 Squankum Yellowbrook Rd Unit 2nd Floor Apt.
- 150 Squankum Yellowbrook Rd
- 189 Squankum Yellowbrook Rd
- 122 Squankum Yellowbrook Rd
- 199 Squankum Yellowbrook Rd
- 245 Squankum Rd
- 2 Jordan Ct
- 1 Jordan Ct
- 12 Daybreak Ct
- 8 Daybreak Ct
- 184 Old Tavern Rd
- 160 Old Tavern Rd
- 293 Squankum Yellowbrook Rd
- 172 Old Tavern Rd
- 73 Lakewood Farmingdale Rd
- 158 Old Tavern Rd
- 222 Old Tavern Rd
- 6 Daybreak Ct