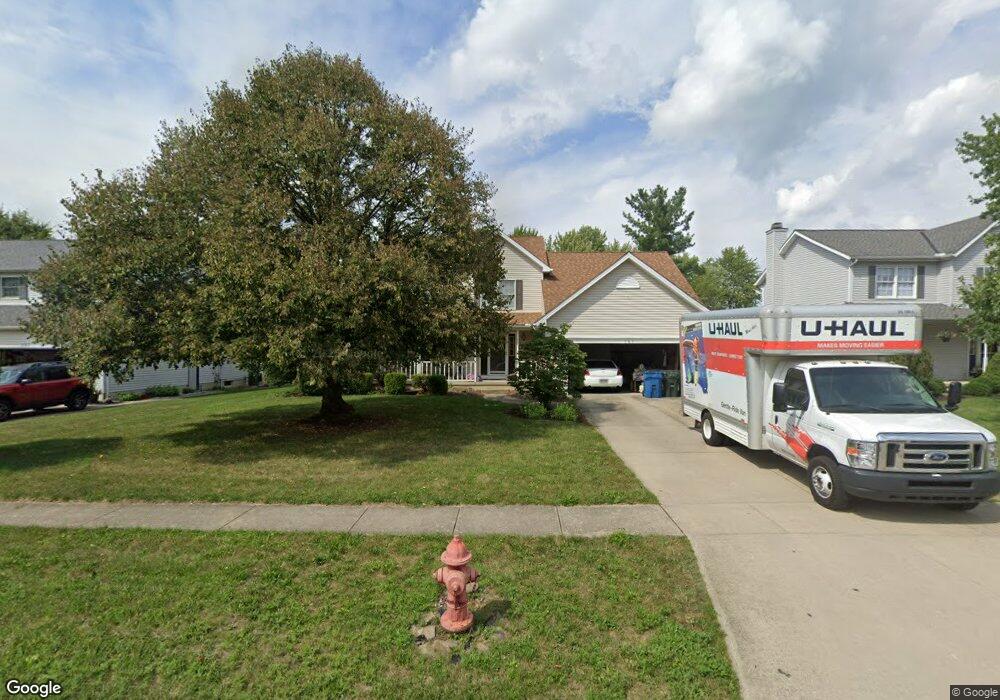
161 Taylor Blvd Lagrange, OH 44050
Estimated Value: $330,350 - $421,000
4
Beds
3
Baths
2,246
Sq Ft
$168/Sq Ft
Est. Value
About This Home
This home is located at 161 Taylor Blvd, Lagrange, OH 44050 and is currently estimated at $376,588, approximately $167 per square foot. 161 Taylor Blvd is a home located in Lorain County with nearby schools including Keystone Elementary School, Keystone Middle School, and Keystone High School.
Ownership History
Date
Name
Owned For
Owner Type
Purchase Details
Closed on
Jun 26, 2013
Sold by
Pribulsky Tina M
Bought by
Pribulsky Tina M and The Tina M Pribulsky Revocable Living Tr
Current Estimated Value
Purchase Details
Closed on
Apr 24, 2002
Sold by
Lacrosse Timothy S and Lacrosse Kristen M
Bought by
Pribulsky Tina M
Home Financials for this Owner
Home Financials are based on the most recent Mortgage that was taken out on this home.
Original Mortgage
$70,000
Outstanding Balance
$29,680
Interest Rate
7.13%
Estimated Equity
$346,908
Purchase Details
Closed on
Dec 1, 2000
Sold by
Sigsworth Robert A and Sigsworth Cheryl Lynn
Bought by
Lacrosse Timothy S and Lacrosse Kristen M
Home Financials for this Owner
Home Financials are based on the most recent Mortgage that was taken out on this home.
Original Mortgage
$168,000
Interest Rate
7.7%
Purchase Details
Closed on
Jul 22, 1996
Sold by
Howington Charles R
Bought by
Sigsworth Robert A and Sigsworth Cheryl L
Create a Home Valuation Report for This Property
The Home Valuation Report is an in-depth analysis detailing your home's value as well as a comparison with similar homes in the area
Home Values in the Area
Average Home Value in this Area
Purchase History
| Date | Buyer | Sale Price | Title Company |
|---|---|---|---|
| Pribulsky Tina M | -- | None Available | |
| Pribulsky Tina M | $233,000 | Midland Title | |
| Lacrosse Timothy S | $218,000 | Midland Title | |
| Sigsworth Robert A | $198,000 | -- |
Source: Public Records
Mortgage History
| Date | Status | Borrower | Loan Amount |
|---|---|---|---|
| Open | Pribulsky Tina M | $70,000 | |
| Previous Owner | Lacrosse Timothy S | $168,000 |
Source: Public Records
Tax History
| Year | Tax Paid | Tax Assessment Tax Assessment Total Assessment is a certain percentage of the fair market value that is determined by local assessors to be the total taxable value of land and additions on the property. | Land | Improvement |
|---|---|---|---|---|
| 2024 | $3,638 | $95,645 | $12,103 | $83,542 |
| 2023 | $3,623 | $80,577 | $11,123 | $69,454 |
| 2022 | $3,620 | $80,577 | $11,123 | $69,454 |
| 2021 | $3,622 | $80,577 | $11,123 | $69,454 |
| 2020 | $3,474 | $70,130 | $9,680 | $60,450 |
| 2019 | $3,454 | $70,130 | $9,680 | $60,450 |
| 2018 | $3,333 | $70,130 | $9,680 | $60,450 |
| 2017 | $3,223 | $64,310 | $8,530 | $55,780 |
| 2016 | $3,201 | $64,310 | $8,530 | $55,780 |
| 2015 | $3,197 | $64,310 | $8,530 | $55,780 |
| 2014 | $3,218 | $63,370 | $8,410 | $54,960 |
| 2013 | $3,121 | $63,370 | $8,410 | $54,960 |
Source: Public Records
Map
Nearby Homes
- 516 Appomattox Ct
- 548 William St
- 608 Rundle St
- 700 Hayes St
- 336 Granger Dr
- 305 W Main St
- 110 Railroad St
- 808 Buckingham Dr
- 800 Buckingham Dr
- 801 Willich Ct
- 613 U s Grant St
- 17327 Wheeler Rd
- 0 Whitehead Rd
- 18022 State Route 301
- 40260 Whitney Rd
- 14768 Whitehead Rd
- 42113 Meadow Ln
- 40175 Banks Rd
- 17058 Chamberlain Rd
- 39112 Parsons Rd
- 165 Taylor Blvd
- 169 Taylor Blvd
- 157 Taylor Blvd
- 153 Taylor Blvd
- 174 Taylor Blvd
- 178 Taylor Blvd
- 170 Taylor Blvd
- 173 Taylor Blvd
- 505 William St
- 182 Taylor Blvd
- 149 Taylor Blvd
- 166 Taylor Blvd
- 33 William
- SL 29 William St
- 509 William St
- 508 Appomattox Ct
- 186 Taylor Blvd
- 162 Taylor Blvd
- 500 Appomattox Ct
- 145 Taylor Blvd
Your Personal Tour Guide
Ask me questions while you tour the home.