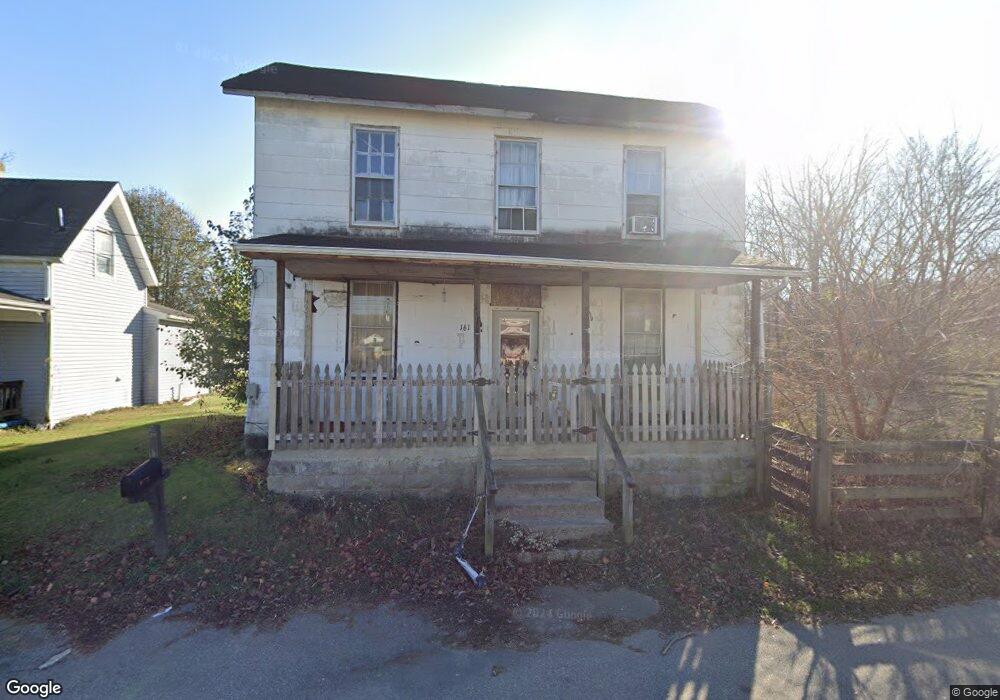
161 Thompson St Morrow, OH 45152
Estimated Value: $144,435 - $266,000
3
Beds
1
Bath
1,222
Sq Ft
$157/Sq Ft
Est. Value
About This Home
This home is located at 161 Thompson St, Morrow, OH 45152 and is currently estimated at $191,609, approximately $156 per square foot. 161 Thompson St is a home located in Warren County with nearby schools including Little Miami Early Childhood Center, Little Miami Intermediate Middle School, and Little Miami Middle School.
Ownership History
Date
Name
Owned For
Owner Type
Purchase Details
Closed on
Apr 8, 1993
Sold by
Bryant York and York Bryant
Bought by
Bryant and Bryant Viola
Current Estimated Value
Purchase Details
Closed on
May 7, 1982
Sold by
York Bryant and York Bryant
Purchase Details
Closed on
May 15, 1978
Sold by
Taylor Taylor and Taylor Robert G
Purchase Details
Closed on
Jan 4, 1978
Sold by
Egner Joyce and Egner Willie B
Create a Home Valuation Report for This Property
The Home Valuation Report is an in-depth analysis detailing your home's value as well as a comparison with similar homes in the area
Home Values in the Area
Average Home Value in this Area
Purchase History
| Date | Buyer | Sale Price | Title Company |
|---|---|---|---|
| Bryant | -- | -- | |
| -- | $3,500 | -- | |
| -- | $7,900 | -- | |
| -- | $4,500 | -- |
Source: Public Records
Tax History
| Year | Tax Paid | Tax Assessment Tax Assessment Total Assessment is a certain percentage of the fair market value that is determined by local assessors to be the total taxable value of land and additions on the property. | Land | Improvement |
|---|---|---|---|---|
| 2025 | $1,029 | $22,290 | $9,410 | $12,880 |
| 2024 | $1,029 | $22,290 | $9,410 | $12,880 |
| 2023 | $820 | $16,243 | $4,823 | $11,420 |
| 2022 | $812 | $16,244 | $4,823 | $11,421 |
| 2021 | $808 | $16,244 | $4,823 | $11,421 |
| 2020 | $760 | $13,206 | $3,920 | $9,286 |
| 2019 | $773 | $13,206 | $3,920 | $9,286 |
| 2018 | $786 | $13,206 | $3,920 | $9,286 |
| 2017 | $729 | $11,981 | $3,605 | $8,376 |
| 2016 | $744 | $11,981 | $3,605 | $8,376 |
| 2015 | $698 | $11,981 | $3,605 | $8,376 |
| 2014 | $756 | $11,630 | $3,500 | $8,130 |
| 2013 | $743 | $13,020 | $3,920 | $9,100 |
Source: Public Records
Map
Nearby Homes
- 3155 Rosemary Ct Unit Lot 94
- 3155 Rosemary Ct
- 105 Welch Rd
- 114 Highlawn Ave
- 4997 Jessica Suzanne Dr
- 4836 Jessica Suzanne Dr
- 6407 Cooper Grace Ln
- 5194 Lucy James Ct
- 6490 Cooper Grace Ln
- 5039 Mary Louise Ct
- 5101 Jessica Suzanne Dr
- 5015 Allens Ridge Dr
- 5168 Allens Ridge Dr
- 5467 Morrow-Blackhawk Rd
- Lot #1 Middleboro Rd
- 5777 U S 22
- 5441 Hopewell Valley Dr
- 5750 Azra Ct
- 6017 Outlook Ct
- 6051 U S 22 Unit 56
Your Personal Tour Guide
Ask me questions while you tour the home.