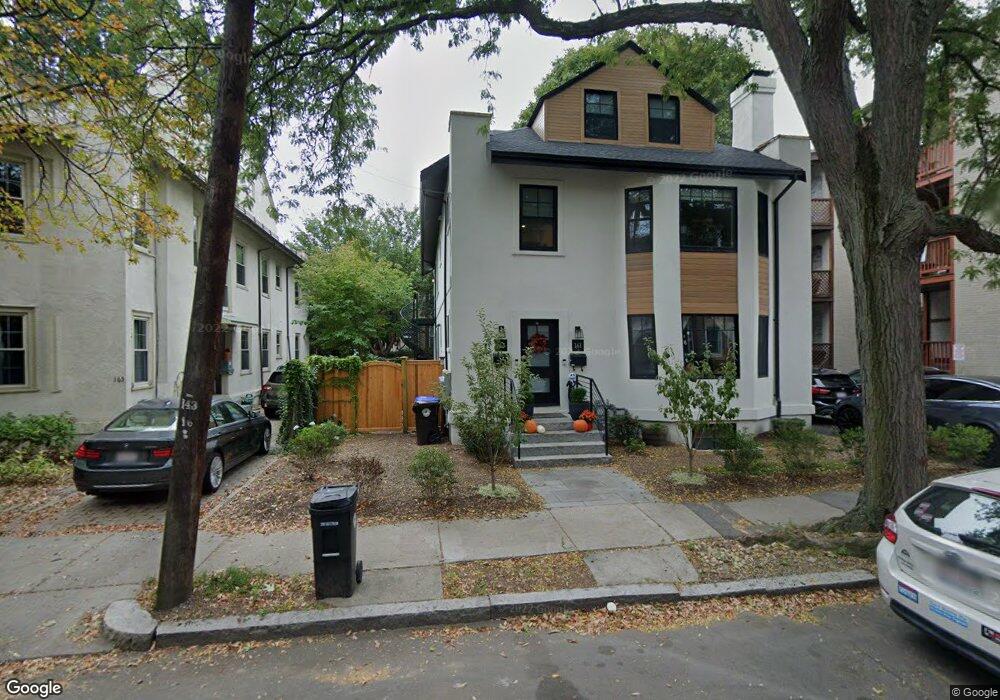
161 Thorndike St Unit 1 Brookline, MA 02446
Coolidge Corner NeighborhoodEstimated Value: $1,990,000 - $2,440,090
4
Beds
4
Baths
1,705
Sq Ft
$1,338/Sq Ft
Est. Value
About This Home
This home is located at 161 Thorndike St Unit 1, Brookline, MA 02446 and is currently estimated at $2,280,773, approximately $1,337 per square foot. 161 Thorndike St Unit 1 is a home located in Norfolk County with nearby schools including Match Charter Public School, New England Hebrew Academy, and Boston University Academy.
Ownership History
Date
Name
Owned For
Owner Type
Purchase Details
Closed on
Apr 22, 2021
Sold by
161-163 Thorndike St Llc
Bought by
Crouch Zachary J
Current Estimated Value
Home Financials for this Owner
Home Financials are based on the most recent Mortgage that was taken out on this home.
Original Mortgage
$1,365,000
Outstanding Balance
$1,230,759
Interest Rate
3.05%
Mortgage Type
Purchase Money Mortgage
Estimated Equity
$1,050,014
Purchase Details
Closed on
May 21, 2019
Sold by
161-163 Thorndike St Llc and Sallen
Bought by
161-163 Thorndike St Llc
Purchase Details
Closed on
Jun 22, 2015
Sold by
Sallen Irwin M and Sallen Irene R
Bought by
161-163 Thorndike St R and Sallen
Purchase Details
Closed on
Nov 2, 1972
Bought by
Sallen I Michael and Sallen Irene S
Create a Home Valuation Report for This Property
The Home Valuation Report is an in-depth analysis detailing your home's value as well as a comparison with similar homes in the area
Home Values in the Area
Average Home Value in this Area
Purchase History
| Date | Buyer | Sale Price | Title Company |
|---|---|---|---|
| Crouch Zachary J | $1,950,000 | None Available | |
| Crouch Zachary J | $1,950,000 | None Available | |
| Crouch Zachary J | $1,950,000 | None Available | |
| Crouch Zachary J | $1,950,000 | None Available | |
| 161-163 Thorndike St Llc | $2,000,000 | -- | |
| 161-163 Thorndike St Llc | $2,000,000 | -- | |
| 161-163 Thorndike St Llc | $2,000,000 | -- | |
| 161-163 Thorndike St Llc | $2,000,000 | -- | |
| 161-163 Thorndike St R | -- | -- | |
| 161-163 Thorndike St R | -- | -- | |
| 161-163 Thorndike St R | -- | -- | |
| 161-163 Thorndike St R | -- | -- | |
| Sallen I Michael | $37,500 | -- | |
| Sallen I Michael | $37,500 | -- |
Source: Public Records
Mortgage History
| Date | Status | Borrower | Loan Amount |
|---|---|---|---|
| Open | Crouch Zachary J | $1,365,000 | |
| Closed | Crouch Zachary J | $1,365,000 |
Source: Public Records
Tax History Compared to Growth
Tax History
| Year | Tax Paid | Tax Assessment Tax Assessment Total Assessment is a certain percentage of the fair market value that is determined by local assessors to be the total taxable value of land and additions on the property. | Land | Improvement |
|---|---|---|---|---|
| 2025 | $21,034 | $2,131,100 | $0 | $2,131,100 |
| 2024 | $20,412 | $2,089,300 | $0 | $2,089,300 |
| 2023 | $19,039 | $1,909,600 | $0 | $1,909,600 |
| 2022 | $32,897 | $3,228,400 | $1,010,200 | $2,218,200 |
| 2021 | $25,148 | $2,566,100 | $971,300 | $1,594,800 |
| 2020 | $19,254 | $2,037,500 | $882,900 | $1,154,600 |
| 2019 | $18,224 | $1,944,900 | $840,900 | $1,104,000 |
| 2018 | $16,508 | $1,745,000 | $700,700 | $1,044,300 |
| 2017 | $15,878 | $1,607,100 | $661,100 | $946,000 |
| 2016 | $14,368 | $1,378,900 | $617,800 | $761,100 |
| 2015 | $13,387 | $1,253,500 | $577,400 | $676,100 |
| 2014 | $12,337 | $1,083,100 | $481,200 | $601,900 |
Source: Public Records
Map
Nearby Homes
- 116 Thorndike St
- 116 Thorndike St Unit 2
- 116 Thorndike St Unit 1
- 85 Naples Rd Unit B
- 85 Naples Rd Unit 2
- 95 Beals St Unit 2
- 11 Abbottsford Rd
- 5 Fiske Terrace
- 28 Verndale St
- 57 Brighton Ave Unit C
- 57 Brighton Ave Unit B
- 57 Brighton Ave Unit A
- 59 Brighton Ave Unit 1
- 233 Freeman St Unit 1
- 373 Harvard St Unit 1
- 107 Centre St Unit A
- 52 Babcock St Unit 6
- 58 Dwight St Unit 6
- 30 Glenville Ave Unit 1
- 99 Crowninshield Rd Unit 99
- 161 Thorndike St Unit 163
- 163 Thorndike St Unit 2
- 163 Thorndike St Unit 163
- 165 Thorndike St
- 165 Thorndike St Unit 338
- 165 Thorndike St Unit 178
- 165 Thorndike St Unit 1
- 81 Gibbs St
- 81 Gibbs St Unit 2
- 81 Gibbs St Unit 3
- 81 Gibbs St
- 81 Gibbs St Unit 3A
- 81 Gibbs St Unit 3CC
- 81 Gibbs St Unit 3A
- 81 Gibbs St Unit 3C
- 81 Gibbs St Unit 30
- 81 Gibbs St Unit 3
- 81 Gibbs St Unit 2
- 81 Gibbs St Unit 1
- 157 Thorndike St Unit 2