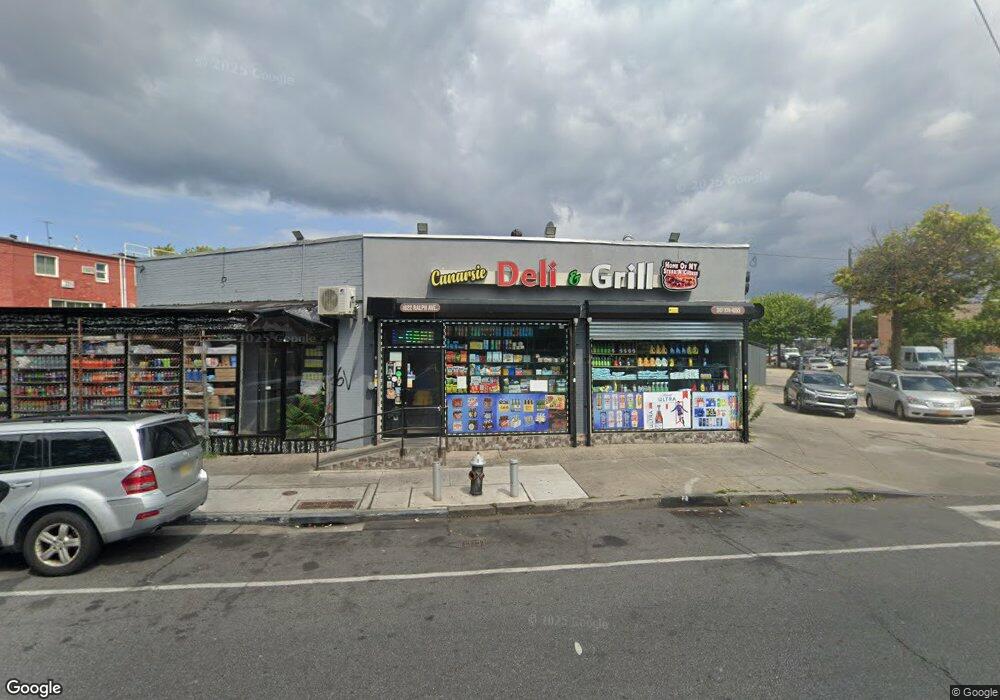
1610-1620 Ralph Ave Brooklyn, NY 11236
Flatlands NeighborhoodEstimated Value: $3,422,624
--
Bed
--
Bath
7,672
Sq Ft
$446/Sq Ft
Est. Value
About This Home
This home is located at 1610-1620 Ralph Ave, Brooklyn, NY 11236 and is currently estimated at $3,422,624, approximately $446 per square foot. 1610-1620 Ralph Ave is a home located in Kings County with nearby schools including P.S. 208 Elsa Ebeling, I.S. 285 Meyer Levin, and Ivy Hill Preparatory Charter School.
Ownership History
Date
Name
Owned For
Owner Type
Purchase Details
Closed on
Jul 15, 2020
Sold by
Ralph Avenue Llc
Bought by
1620 Ralph Avenue Owner Llc
Current Estimated Value
Purchase Details
Closed on
Dec 22, 2004
Sold by
1620 Ralph Avenue Corp
Bought by
Ralph Avenue Llc
Home Financials for this Owner
Home Financials are based on the most recent Mortgage that was taken out on this home.
Original Mortgage
$800,000
Interest Rate
5.75%
Mortgage Type
Commercial
Create a Home Valuation Report for This Property
The Home Valuation Report is an in-depth analysis detailing your home's value as well as a comparison with similar homes in the area
Home Values in the Area
Average Home Value in this Area
Purchase History
| Date | Buyer | Sale Price | Title Company |
|---|---|---|---|
| 1620 Ralph Avenue Owner Llc | $2,800,000 | -- | |
| Ralph Avenue Llc | $1,140,000 | -- | |
| Ralph Avenue Llc | $1,140,000 | -- |
Source: Public Records
Mortgage History
| Date | Status | Borrower | Loan Amount |
|---|---|---|---|
| Previous Owner | Ralph Avenue Llc | $800,000 |
Source: Public Records
Tax History Compared to Growth
Tax History
| Year | Tax Paid | Tax Assessment Tax Assessment Total Assessment is a certain percentage of the fair market value that is determined by local assessors to be the total taxable value of land and additions on the property. | Land | Improvement |
|---|---|---|---|---|
| 2025 | $60,486 | $703,800 | $140,850 | $562,950 |
| 2024 | $60,486 | $571,050 | $140,850 | $430,200 |
| 2023 | $57,201 | $537,300 | $140,850 | $396,450 |
| 2022 | $31,773 | $590,850 | $140,850 | $450,000 |
| 2021 | $50,000 | $467,550 | $140,850 | $326,700 |
| 2020 | $31,676 | $619,200 | $140,850 | $478,350 |
| 2019 | $58,176 | $612,000 | $140,850 | $471,150 |
| 2018 | $54,325 | $595,350 | $140,850 | $454,500 |
| 2017 | $50,861 | $591,750 | $140,850 | $450,900 |
| 2016 | $47,602 | $500,850 | $140,850 | $360,000 |
| 2015 | $19,553 | $466,650 | $140,850 | $325,800 |
| 2014 | $19,553 | $428,850 | $140,850 | $288,000 |
Source: Public Records
Map
Nearby Homes