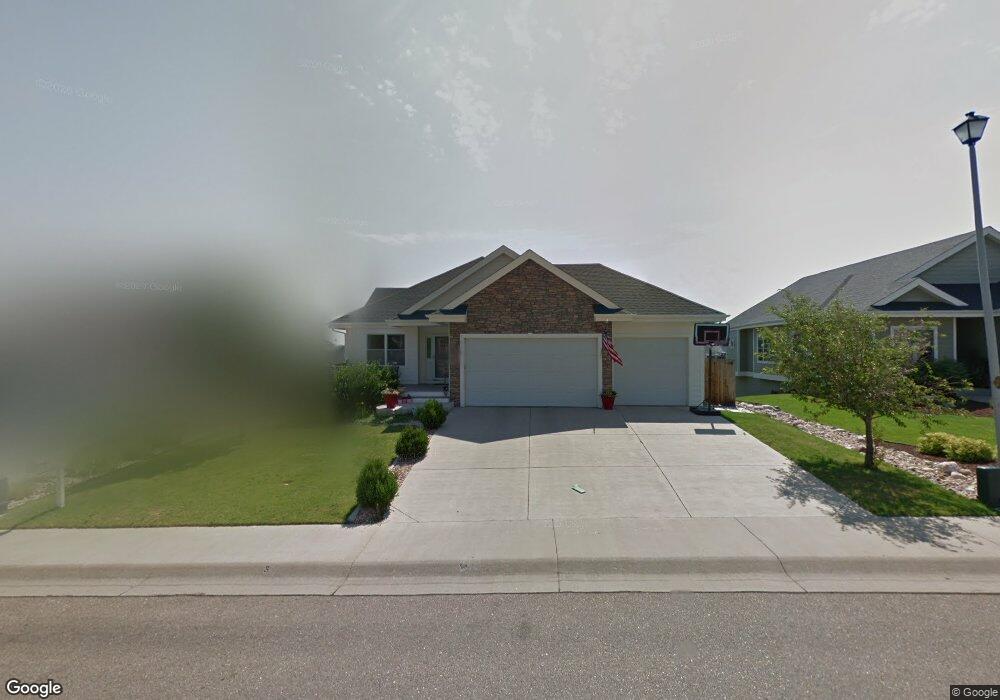
1610 69th Ave Greeley, CO 80634
Estimated Value: $493,721 - $565,000
3
Beds
3
Baths
1,746
Sq Ft
$302/Sq Ft
Est. Value
About This Home
This home is located at 1610 69th Ave, Greeley, CO 80634 and is currently estimated at $526,430, approximately $301 per square foot. 1610 69th Ave is a home located in Weld County with nearby schools including Greeley Central High School, University Schools, and West Ridge Academy Charter.
Ownership History
Date
Name
Owned For
Owner Type
Purchase Details
Closed on
Nov 15, 2019
Sold by
Wells Fargo Bank Na
Bought by
Thornton Todd A and Thornton Jacqueline L
Current Estimated Value
Purchase Details
Closed on
Dec 13, 2010
Sold by
Federal National Mortgage Association
Bought by
Wells Fargo Bank Na
Purchase Details
Closed on
Apr 9, 2010
Sold by
Thornton Todd A and Thornton Jacqueline L
Bought by
Federal National Mortgage Association
Purchase Details
Closed on
Apr 10, 2003
Sold by
Dennis Gibson Contracting Llc
Bought by
Thornton Todd A and Thornton Jacqueline L
Home Financials for this Owner
Home Financials are based on the most recent Mortgage that was taken out on this home.
Original Mortgage
$258,900
Interest Rate
4.87%
Purchase Details
Closed on
Oct 7, 2002
Sold by
Gibson Contracting Inc
Bought by
Dennis Gibson Contracting Llc
Purchase Details
Closed on
Apr 19, 2002
Sold by
Cedarwoods Subdivision Llc
Bought by
Gibson Contracting Inc
Create a Home Valuation Report for This Property
The Home Valuation Report is an in-depth analysis detailing your home's value as well as a comparison with similar homes in the area
Purchase History
| Date | Buyer | Sale Price | Title Company |
|---|---|---|---|
| Thornton Todd A | -- | None Available | |
| Wells Fargo Bank Na | -- | None Available | |
| Federal National Mortgage Association | -- | None Available | |
| Thornton Todd A | $258,900 | -- | |
| Dennis Gibson Contracting Llc | -- | -- | |
| Gibson Contracting Inc | $42,520 | -- |
Source: Public Records
Mortgage History
| Date | Status | Borrower | Loan Amount |
|---|---|---|---|
| Previous Owner | Thornton Todd A | $258,900 |
Source: Public Records
Tax History
| Year | Tax Paid | Tax Assessment Tax Assessment Total Assessment is a certain percentage of the fair market value that is determined by local assessors to be the total taxable value of land and additions on the property. | Land | Improvement |
|---|---|---|---|---|
| 2025 | $2,544 | $33,400 | $5,000 | $28,400 |
| 2024 | $2,544 | $33,400 | $5,000 | $28,400 |
| 2023 | $2,426 | $33,860 | $5,410 | $28,450 |
| 2022 | $2,480 | $28,310 | $5,000 | $23,310 |
| 2021 | $2,577 | $29,130 | $5,150 | $23,980 |
| 2020 | $2,439 | $27,660 | $3,430 | $24,230 |
| 2019 | $2,446 | $27,660 | $3,430 | $24,230 |
| 2018 | $1,922 | $22,930 | $2,950 | $19,980 |
| 2017 | $1,935 | $22,930 | $2,950 | $19,980 |
| 2016 | $1,731 | $23,000 | $2,790 | $20,210 |
| 2015 | $1,724 | $23,000 | $2,790 | $20,210 |
| 2014 | $1,409 | $18,350 | $2,790 | $15,560 |
Source: Public Records
Map
Nearby Homes
- 1470 71st Ave
- 1732 70th Ave
- 1743 68th Ave
- 6925 W 19th St Unit 15
- 1900 68th Ave Unit 104
- 1900 68th Ave Unit 11 5
- 1900 68th Ave Unit 810
- 7304 W 18th Street Rd
- 6405 W 16th St
- 7203 W 20th Street Ln
- 1505 63rd Avenue Ct
- 7213 W 21st St
- 6805 W 23rd St
- 1404 60th Ave
- 2223 72nd Ave
- 2222 75th Ave
- 6600 W 20th St Unit 27
- 718 66th Ave
- 6620 7th St
- 627 67th Ave
- 1606 69th Ave
- 1614 69th Ave
- 1613 68th Ave
- 1609 68th Ave
- 1617 68th Ave
- 6808 16th Street Rd
- 6804 16th Street Rd
- 1621 68th Ave
- 1611 69th Ave
- 1622 69th Ave
- 1615 69th Ave
- 1607 69th Ave
- 6800 16th Street Rd
- 1619 69th Ave
- 6904 16th Street Rd
- 1625 68th Ave
- 1623 69th Ave
- 1620 70th Ave
- 6908 16th Street Rd
- 1616 68th Ave
Your Personal Tour Guide
Ask me questions while you tour the home.