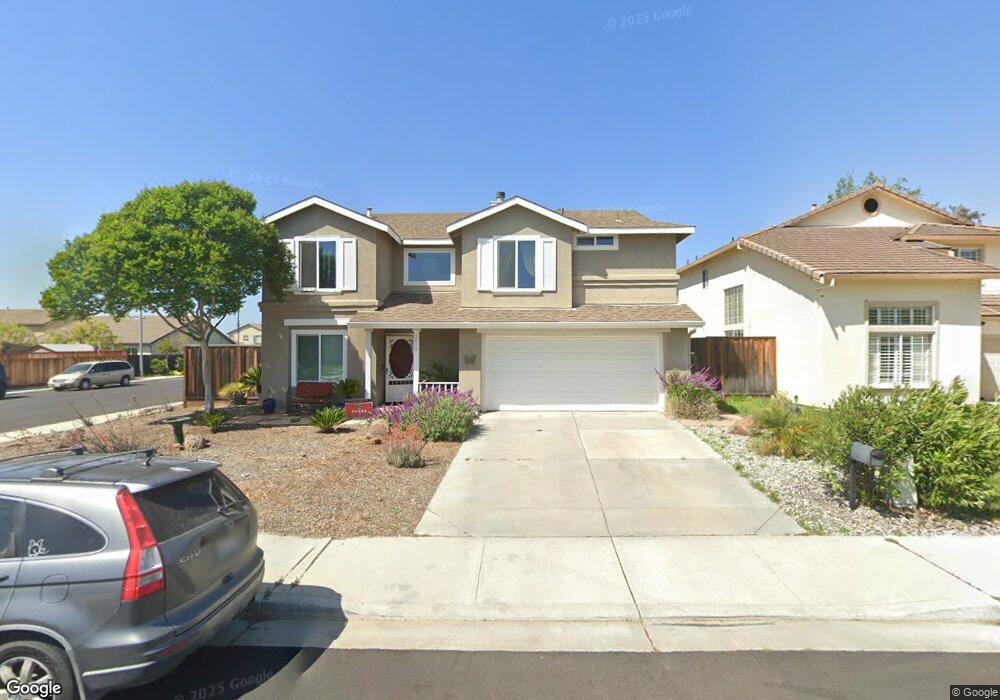
1610 Brighton Dr Hollister, CA 95023
Estimated Value: $766,000 - $794,000
3
Beds
3
Baths
2,061
Sq Ft
$378/Sq Ft
Est. Value
About This Home
This home is located at 1610 Brighton Dr, Hollister, CA 95023 and is currently estimated at $779,385, approximately $378 per square foot. 1610 Brighton Dr is a home located in San Benito County with nearby schools including Cerra Vista Elementary School, Rancho San Justo School, and San Benito High School.
Ownership History
Date
Name
Owned For
Owner Type
Purchase Details
Closed on
Oct 29, 2009
Sold by
Diaz Jesse R
Bought by
Jacques Joshua and Jacques Lorena
Current Estimated Value
Home Financials for this Owner
Home Financials are based on the most recent Mortgage that was taken out on this home.
Original Mortgage
$304,385
Outstanding Balance
$197,937
Interest Rate
4.92%
Mortgage Type
FHA
Estimated Equity
$581,448
Purchase Details
Closed on
Jan 4, 2007
Sold by
Diaz Jesse R and Brenzel Betsy B
Bought by
Diaz Jesse R
Home Financials for this Owner
Home Financials are based on the most recent Mortgage that was taken out on this home.
Original Mortgage
$537,600
Interest Rate
6.12%
Mortgage Type
New Conventional
Purchase Details
Closed on
Jul 13, 2005
Sold by
Pond David and Pond Christy
Bought by
Diaz Jesse R and Brenzel Betsy B
Home Financials for this Owner
Home Financials are based on the most recent Mortgage that was taken out on this home.
Original Mortgage
$526,800
Interest Rate
5.5%
Mortgage Type
Unknown
Create a Home Valuation Report for This Property
The Home Valuation Report is an in-depth analysis detailing your home's value as well as a comparison with similar homes in the area
Home Values in the Area
Average Home Value in this Area
Purchase History
| Date | Buyer | Sale Price | Title Company |
|---|---|---|---|
| Jacques Joshua | $310,000 | Chicago Title Company | |
| Diaz Jesse R | -- | First American Title Co | |
| Diaz Jesse R | $658,500 | First American Title Co |
Source: Public Records
Mortgage History
| Date | Status | Borrower | Loan Amount |
|---|---|---|---|
| Open | Jacques Joshua | $304,385 | |
| Previous Owner | Diaz Jesse R | $537,600 | |
| Previous Owner | Diaz Jesse R | $526,800 |
Source: Public Records
Tax History Compared to Growth
Tax History
| Year | Tax Paid | Tax Assessment Tax Assessment Total Assessment is a certain percentage of the fair market value that is determined by local assessors to be the total taxable value of land and additions on the property. | Land | Improvement |
|---|---|---|---|---|
| 2025 | $4,764 | $399,192 | $135,207 | $263,985 |
| 2023 | $4,764 | $383,692 | $129,957 | $253,735 |
| 2022 | $4,594 | $376,169 | $127,409 | $248,760 |
| 2021 | $4,530 | $368,794 | $124,911 | $243,883 |
| 2020 | $4,549 | $365,014 | $123,631 | $241,383 |
| 2019 | $4,417 | $357,857 | $121,207 | $236,650 |
| 2018 | $4,327 | $350,841 | $118,831 | $232,010 |
| 2017 | $4,519 | $343,962 | $116,501 | $227,461 |
| 2016 | $4,267 | $337,218 | $114,217 | $223,001 |
| 2015 | $4,228 | $332,154 | $112,502 | $219,652 |
| 2014 | $3,992 | $325,649 | $110,299 | $215,350 |
Source: Public Records
Map
Nearby Homes
- 1600 Panorama Dr
- 1531 Brighton Dr
- 2260 Ventana Ct
- 2711 Valley View Rd
- 2230 Ventana Ct
- 2110 Glenview Dr
- 2180 Clearview Dr
- 1871 Peony St
- 2102 White Oak Dr
- 1880 Peony St
- 1890 Peony St
- 1911 Peony St
- 1900 Lotus Ct
- 1900 Peony St
- 1871 Amaryllis Dr
- 1910 Peony St
- 1921 Peony St
- 1920 Peony St
- 1740 Brentwood Ct
- 1901 Amaryllis Dr
- 1620 Brighton Dr
- 1591 Panorama Dr
- 1601 Panorama Dr
- 1630 Brighton Dr
- 1621 Panorama Dr
- 1581 Panorama Dr
- 1611 Brighton Dr
- 1601 Brighton Dr
- 1631 Brighton Dr
- 1591 Brighton Dr
- 1570 Brighton Dr
- 1631 Panorama Dr
- 1571 Panorama Dr
- 1651 Brighton Dr
- 1581 Brighton Dr
- 1670 Brighton Dr
- 1641 Panorama Dr
- 2209 Cerra Vista Dr
- 1560 Brighton Dr
- 1561 Panorama Dr