Estimated Value: $213,000 - $476,000
3
Beds
2
Baths
1,562
Sq Ft
$214/Sq Ft
Est. Value
About This Home
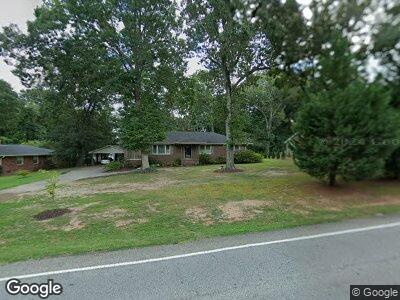
This home is located at 1610 Hudson Rd, Greer, SC 29650 and is currently estimated at $334,044, approximately $213 per square foot. 1610 Hudson Rd is a home located in Greenville County with nearby schools including Pelham Road Elementary School, Greenville Middle Academy, and Eastside High School.
Ownership History
Date
Name
Owned For
Owner Type
Purchase Details
Closed on
Nov 11, 2008
Sold by
Cartus Financial Corporation
Bought by
Magnus Ann O
Current Estimated Value
Home Financials for this Owner
Home Financials are based on the most recent Mortgage that was taken out on this home.
Original Mortgage
$102,200
Interest Rate
6.51%
Mortgage Type
Purchase Money Mortgage
Purchase Details
Closed on
Nov 7, 2008
Sold by
Stranger Patricia Ann and Stranger Dana J
Bought by
Cartus Financial Corporation
Home Financials for this Owner
Home Financials are based on the most recent Mortgage that was taken out on this home.
Original Mortgage
$102,200
Interest Rate
6.51%
Mortgage Type
Purchase Money Mortgage
Purchase Details
Closed on
Jun 3, 2005
Sold by
Wittner Clint W
Bought by
Stranger Dana J
Home Financials for this Owner
Home Financials are based on the most recent Mortgage that was taken out on this home.
Original Mortgage
$70,000
Interest Rate
5.66%
Mortgage Type
New Conventional
Create a Home Valuation Report for This Property
The Home Valuation Report is an in-depth analysis detailing your home's value as well as a comparison with similar homes in the area
Home Values in the Area
Average Home Value in this Area
Purchase History
| Date | Buyer | Sale Price | Title Company |
|---|---|---|---|
| Magnus Ann O | $132,200 | -- | |
| Cartus Financial Corporation | $132,200 | -- | |
| Stranger Dana J | $119,900 | -- |
Source: Public Records
Mortgage History
| Date | Status | Borrower | Loan Amount |
|---|---|---|---|
| Open | Magnus Ann O | $99,700 | |
| Closed | Magnus Ann O | $102,200 | |
| Previous Owner | Stranger Dana J | $70,000 | |
| Previous Owner | Stranger Dena J | $25,900 |
Source: Public Records
Tax History Compared to Growth
Tax History
| Year | Tax Paid | Tax Assessment Tax Assessment Total Assessment is a certain percentage of the fair market value that is determined by local assessors to be the total taxable value of land and additions on the property. | Land | Improvement |
|---|---|---|---|---|
| 2024 | $621 | $3,800 | $1,840 | $1,960 |
| 2023 | $621 | $3,800 | $1,840 | $1,960 |
| 2022 | $575 | $3,800 | $1,840 | $1,960 |
| 2021 | $576 | $3,800 | $1,840 | $1,960 |
| 2020 | $543 | $3,300 | $1,000 | $2,300 |
| 2019 | $533 | $3,300 | $1,000 | $2,300 |
| 2018 | $550 | $3,300 | $1,000 | $2,300 |
| 2017 | $546 | $3,300 | $1,000 | $2,300 |
| 2016 | $510 | $82,540 | $25,000 | $57,540 |
| 2015 | $504 | $82,540 | $25,000 | $57,540 |
| 2014 | $569 | $94,130 | $25,000 | $69,130 |
Source: Public Records
Map
Nearby Homes
- 202 Rosebud Ct
- 3 Hibourne Ct
- 117 Terrence Ct
- 200 Ladbroke Rd
- 205 Rosebank Way
- 116 Saddle Tree Ct
- 114 Woodstock Ln
- 216 Ashmore Rd
- 120 Cherrywood Trail
- 407 Great Glen Rd
- 100 Breeds Hill Way
- 11 Dover Dr
- 7 Riverton Ct
- 101 N Lady Slipper Ln
- 333 Devonwood Ct
- 100 Heatherbrook Rd
- 211 Governors Square
- 301 Devenger Rd
- 19 Terramont Dr
- 4614 Old Spartanburg Rd Unit 8
- 1610 Hudson Rd
- 1606 Hudson Rd
- 1614 Hudson Rd
- 1604 Hudson Rd
- 302 Rosebud Ct
- 304 Rosebud Ct
- 1715 Hudson Rd
- 306 Rosebud Ct
- 300 Rosebud Ct
- 1607 Hudson Rd
- 1601 Hudson Rd
- 102 Cassette Ct
- 1609 Hudson Rd
- 103 Sherard Ct
- 1618 Hudson Rd
- 100 Cassette Ct
- 104 Cassette Ct
- 206 Carolena Rose Way
- 301 Rosebud Ct
- 1611 Hudson Rd