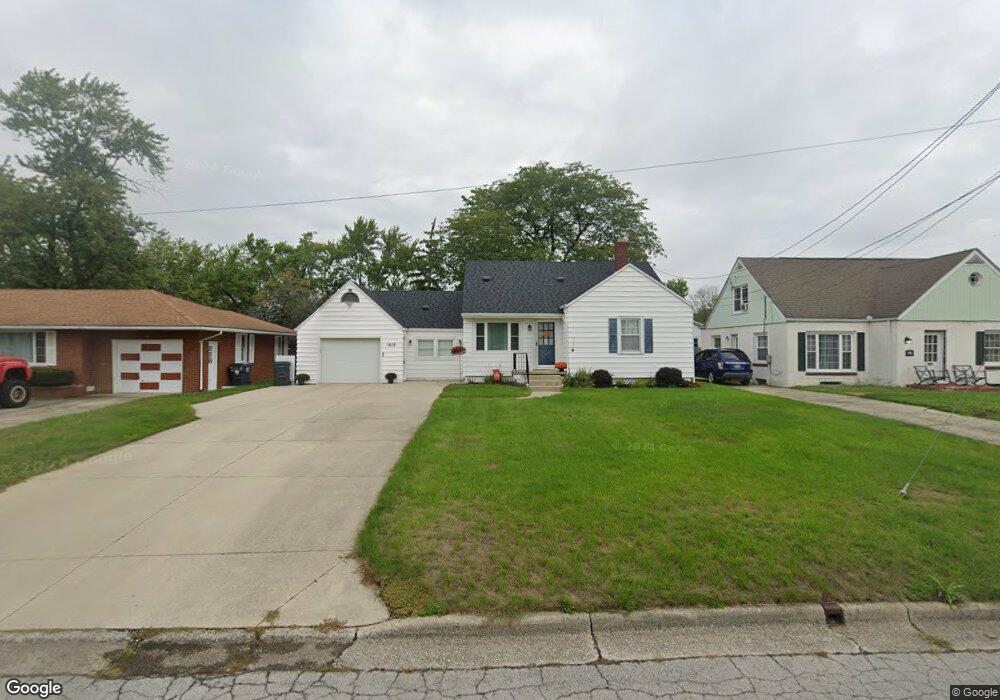
1610 Leland Ave Lima, OH 45805
Westgate NeighborhoodEstimated Value: $142,983 - $165,000
2
Beds
1
Bath
1,351
Sq Ft
$112/Sq Ft
Est. Value
About This Home
This home is located at 1610 Leland Ave, Lima, OH 45805 and is currently estimated at $150,996, approximately $111 per square foot. 1610 Leland Ave is a home located in Allen County with nearby schools including Heritage Elementary School, Lima West Middle School, and Lima North Middle School.
Ownership History
Date
Name
Owned For
Owner Type
Purchase Details
Closed on
Nov 16, 2007
Sold by
Wise Douglas Allen
Bought by
Wise Chrystal Renee
Current Estimated Value
Purchase Details
Closed on
May 26, 1995
Sold by
Mccolloch Thomas
Bought by
Wise Douglas and Wise Chrystal
Home Financials for this Owner
Home Financials are based on the most recent Mortgage that was taken out on this home.
Original Mortgage
$56,525
Interest Rate
8.4%
Mortgage Type
New Conventional
Purchase Details
Closed on
Feb 26, 1993
Sold by
Gallier Shane A
Bought by
Melei Sondra Lynn
Purchase Details
Closed on
Oct 6, 1988
Bought by
Gallier Shane A
Create a Home Valuation Report for This Property
The Home Valuation Report is an in-depth analysis detailing your home's value as well as a comparison with similar homes in the area
Home Values in the Area
Average Home Value in this Area
Purchase History
| Date | Buyer | Sale Price | Title Company |
|---|---|---|---|
| Wise Chrystal Renee | -- | None Available | |
| Wise Douglas | $59,500 | -- | |
| Melei Sondra Lynn | $53,900 | -- | |
| Gallier Shane A | $47,400 | -- |
Source: Public Records
Mortgage History
| Date | Status | Borrower | Loan Amount |
|---|---|---|---|
| Closed | Wise Douglas | $56,525 |
Source: Public Records
Tax History
| Year | Tax Paid | Tax Assessment Tax Assessment Total Assessment is a certain percentage of the fair market value that is determined by local assessors to be the total taxable value of land and additions on the property. | Land | Improvement |
|---|---|---|---|---|
| 2024 | $1,292 | $35,700 | $6,720 | $28,980 |
| 2023 | $1,203 | $28,810 | $5,430 | $23,380 |
| 2022 | $1,210 | $28,810 | $5,430 | $23,380 |
| 2021 | $1,280 | $28,810 | $5,430 | $23,380 |
| 2020 | $1,145 | $22,690 | $5,150 | $17,540 |
| 2019 | $1,145 | $22,690 | $5,150 | $17,540 |
| 2018 | $1,128 | $22,690 | $5,150 | $17,540 |
| 2017 | $1,031 | $20,200 | $5,150 | $15,050 |
| 2016 | $1,039 | $20,200 | $5,150 | $15,050 |
| 2015 | $1,063 | $20,200 | $5,150 | $15,050 |
| 2014 | $1,142 | $22,090 | $5,220 | $16,870 |
| 2013 | $1,112 | $22,090 | $5,220 | $16,870 |
Source: Public Records
Map
Nearby Homes
- 1600 Leland Ave
- 1605 Hazel Ave
- 1407 Latham Ave
- 1517 Allentown Rd
- 1245 Latham Ave
- 1607 W Wayne St
- 1753 Leland Ave
- 1716 Oakland Pkwy
- 1508 Oakland Pkwy
- 1209 Rice Ave
- 3 Poulston Place
- 705 Cornell Dr
- 1541 Oakland Pkwy
- 1015 N Cole St
- 1918 Oakland Pkwy
- 0 Latham
- 1160 Richie Ave
- 1120 Richie Ave
- 102 Charwood Dr
- 275 N Dale Dr
- 1606 Leland Ave
- 1620 Leland Ave
- 719 N Nixon Ave
- 700 Loretta Place
- 637 N Nixon Ave
- 706 Loretta Place
- 723 N Nixon Ave
- 1568 Leland Ave
- 1566 Leland Ave
- 621 N Nixon Ave
- 720 N Nixon Ave
- 660 N Nixon Ave
- 1560 Leland Ave
- 724 N Nixon Ave
- 801 N Nixon Ave
- 801 N Nixon Ave
- 620 N Nixon Ave
- 1556 Leland Ave
- 1602 Hazel Ave
- 709 Loretta Place
Your Personal Tour Guide
Ask me questions while you tour the home.