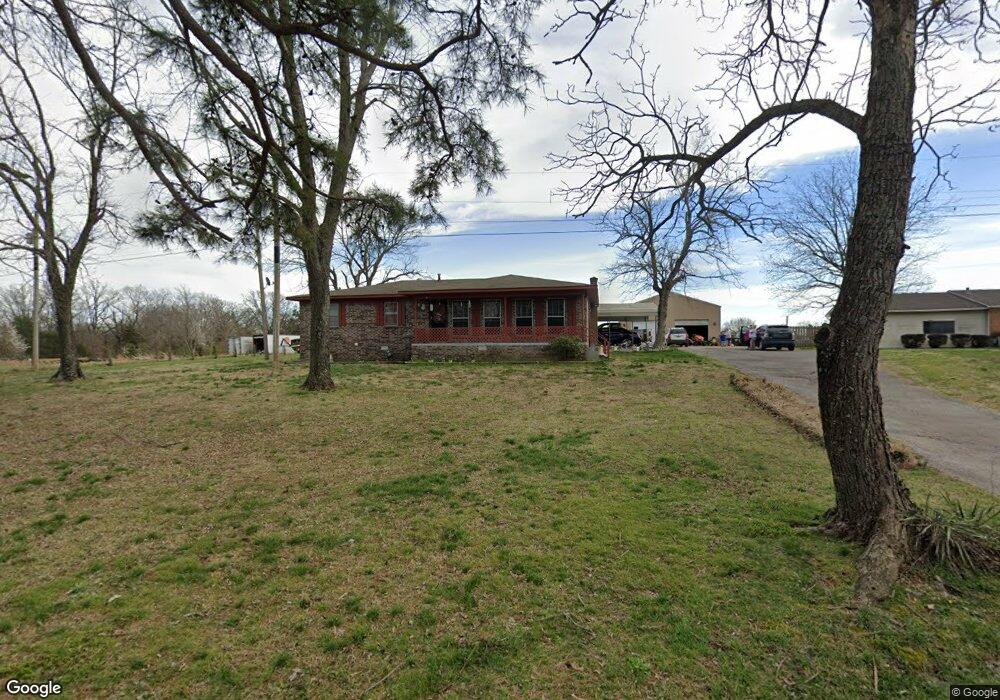
1610 Millcreek Rd Pocahontas, AR 72455
Estimated Value: $158,000 - $318,000
--
Bed
2
Baths
1,442
Sq Ft
$167/Sq Ft
Est. Value
About This Home
This home is located at 1610 Millcreek Rd, Pocahontas, AR 72455 and is currently estimated at $241,178, approximately $167 per square foot. 1610 Millcreek Rd is a home located in Randolph County with nearby schools including Pocahontas Elementary School, M.D. Williams Middle School, and Pocahontas Junior High School.
Ownership History
Date
Name
Owned For
Owner Type
Purchase Details
Closed on
Jan 13, 2020
Sold by
Miles Randall L and Miles Patsy Lee
Bought by
Lynch Shawna Renee and Lynch David Alexander
Current Estimated Value
Home Financials for this Owner
Home Financials are based on the most recent Mortgage that was taken out on this home.
Original Mortgage
$176,739
Outstanding Balance
$156,456
Interest Rate
3.7%
Mortgage Type
FHA
Estimated Equity
$84,722
Purchase Details
Closed on
Apr 16, 2007
Bought by
Strop To Miles
Purchase Details
Closed on
Apr 16, 2001
Bought by
Fed Home Loan Mort To Strop
Purchase Details
Closed on
Jan 8, 2001
Bought by
Homeside Lending Inc To Federal and Home Loan Mortgage Corp
Purchase Details
Closed on
Sep 3, 1997
Bought by
Majors To Ferrell
Purchase Details
Closed on
Apr 1, 1994
Bought by
Gaines To Majors
Create a Home Valuation Report for This Property
The Home Valuation Report is an in-depth analysis detailing your home's value as well as a comparison with similar homes in the area
Home Values in the Area
Average Home Value in this Area
Purchase History
| Date | Buyer | Sale Price | Title Company |
|---|---|---|---|
| Lynch Shawna Renee | $180,000 | Amrock Inc | |
| Strop To Miles | $105,000 | -- | |
| Fed Home Loan Mort To Strop | -- | -- | |
| Homeside Lending Inc To Federal | -- | -- | |
| Majors To Ferrell | $89,000 | -- | |
| Gaines To Majors | $75,000 | -- |
Source: Public Records
Mortgage History
| Date | Status | Borrower | Loan Amount |
|---|---|---|---|
| Open | Lynch Shawna Renee | $176,739 |
Source: Public Records
Tax History Compared to Growth
Tax History
| Year | Tax Paid | Tax Assessment Tax Assessment Total Assessment is a certain percentage of the fair market value that is determined by local assessors to be the total taxable value of land and additions on the property. | Land | Improvement |
|---|---|---|---|---|
| 2024 | $744 | $32,065 | $3,595 | $28,470 |
| 2023 | $819 | $32,065 | $3,595 | $28,470 |
| 2022 | $911 | $32,105 | $3,595 | $28,510 |
| 2021 | $911 | $32,105 | $3,595 | $28,510 |
| 2020 | $747 | $28,915 | $3,595 | $25,320 |
| 2019 | $769 | $34,590 | $3,080 | $31,510 |
| 2018 | $774 | $34,590 | $3,080 | $31,510 |
| 2017 | $657 | $34,630 | $3,080 | $31,550 |
| 2016 | $527 | $32,850 | $1,715 | $31,135 |
| 2015 | $529 | $32,850 | $1,715 | $31,135 |
| 2014 | $479 | $32,850 | $1,715 | $31,135 |
Source: Public Records
Map
Nearby Homes
- 1344 Millcreek Rd
- TBD Highway 166 S
- 100 Kearby Ln
- 1104 Newberry Rd
- TBD Westwood Rd
- 2288 U S 62
- 2308 Archer St
- 1108 S Park St
- 1535 Birdell St
- 1477 Highway 166 S
- 602 S Park St
- 1611 Shelton Cove
- 1105 Birdell St
- 2011 Convent St
- 0 S Pratt St
- 2213 Johnson Cir
- 1406 Hospital Dr
- 2100 Lee St
- 1715 Convent St
- 1004 Ridgecrest St
- 1521 Millcreek Rd
- 1634 Millcreek Rd
- 1633 Millcreek Rd
- 1579 Millcreek Rd
- 1719 Millcreek Rd
- 1736 Millcreek Rd
- 1470 Millcreek Rd
- 1442 Millcreek Rd
- 1768 Millcreek Rd
- 291 Rose Rd
- 1368 Millcreek Rd
- 512 Highway 166 S
- 165 Kearby Ln
- 546 Highway 166 S
- 1353 Millcreek Rd
- 388 Highway 166 S
- 71 Rose Rd
- 466 Highway 166 S
- 363 Rose Rd
- 590 Highway 166 S