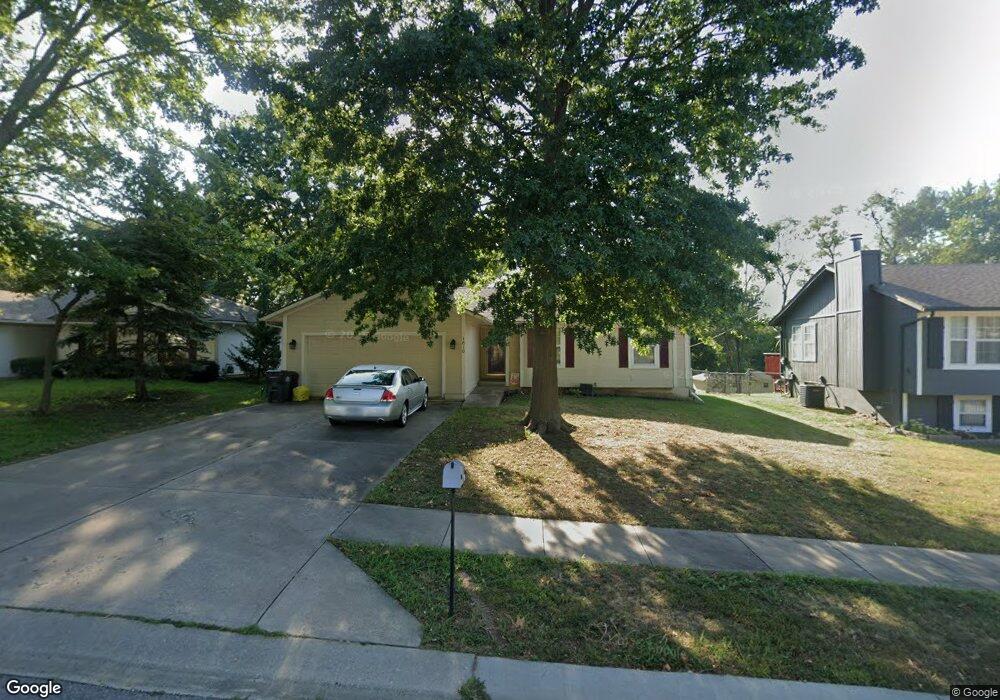
1610 N Lazy Branch Rd Independence, MO 64058
Estimated Value: $259,000 - $311,000
4
Beds
3
Baths
1,180
Sq Ft
$239/Sq Ft
Est. Value
About This Home
This home is located at 1610 N Lazy Branch Rd, Independence, MO 64058 and is currently estimated at $282,476, approximately $239 per square foot. 1610 N Lazy Branch Rd is a home located in Jackson County with nearby schools including Fort Osage High School.
Ownership History
Date
Name
Owned For
Owner Type
Purchase Details
Closed on
Aug 3, 2006
Sold by
Carrender Aron and Carrender Cristi
Bought by
Sugg Sally J
Current Estimated Value
Home Financials for this Owner
Home Financials are based on the most recent Mortgage that was taken out on this home.
Original Mortgage
$109,600
Outstanding Balance
$8,807
Interest Rate
6.66%
Mortgage Type
Purchase Money Mortgage
Estimated Equity
$273,669
Purchase Details
Closed on
Oct 17, 1997
Sold by
Paul Ford Construction Inc
Bought by
Spidle Nevin H and Spidle Tammy R
Home Financials for this Owner
Home Financials are based on the most recent Mortgage that was taken out on this home.
Original Mortgage
$95,501
Interest Rate
7.54%
Mortgage Type
FHA
Purchase Details
Closed on
May 27, 1997
Sold by
Summit Ridge Investment Inc
Bought by
Paul Ford Construction
Home Financials for this Owner
Home Financials are based on the most recent Mortgage that was taken out on this home.
Original Mortgage
$75,000
Interest Rate
8.17%
Mortgage Type
Purchase Money Mortgage
Create a Home Valuation Report for This Property
The Home Valuation Report is an in-depth analysis detailing your home's value as well as a comparison with similar homes in the area
Home Values in the Area
Average Home Value in this Area
Purchase History
| Date | Buyer | Sale Price | Title Company |
|---|---|---|---|
| Sugg Sally J | -- | Assured Quality Title Co | |
| Spidle Nevin H | -- | -- | |
| Paul Ford Construction | -- | -- |
Source: Public Records
Mortgage History
| Date | Status | Borrower | Loan Amount |
|---|---|---|---|
| Open | Sugg Sally J | $109,600 | |
| Previous Owner | Spidle Nevin H | $95,501 | |
| Previous Owner | Paul Ford Construction | $75,000 |
Source: Public Records
Tax History Compared to Growth
Tax History
| Year | Tax Paid | Tax Assessment Tax Assessment Total Assessment is a certain percentage of the fair market value that is determined by local assessors to be the total taxable value of land and additions on the property. | Land | Improvement |
|---|---|---|---|---|
| 2025 | $3,805 | $44,050 | $7,051 | $36,999 |
| 2024 | $3,771 | $42,541 | $8,480 | $34,061 |
| 2023 | $3,771 | $42,541 | $8,480 | $34,061 |
| 2022 | $3,324 | $35,530 | $5,472 | $30,058 |
| 2021 | $3,328 | $35,530 | $5,472 | $30,058 |
| 2020 | $3,063 | $32,231 | $5,472 | $26,759 |
| 2019 | $3,001 | $32,231 | $5,472 | $26,759 |
| 2018 | $2,258 | $24,150 | $3,153 | $20,997 |
| 2017 | $2,258 | $24,150 | $3,153 | $20,997 |
| 2016 | $1,944 | $22,519 | $303 | $22,216 |
| 2014 | $1,914 | $22,078 | $297 | $21,781 |
Source: Public Records
Map
Nearby Homes
- 1713 N Arapaho Ct
- 18901 E Lynchburg Place N
- 1511 Osage Trail
- 18104 E 17th St N
- 18108 E Shoshone Dr
- 17800 E Whitney Rd
- 19204 E 15th St N
- 2006 N Concord Rd
- 2015 N Lazy Branch Rd
- 0 E 24 Highway Cir
- 18729 E 13th Terrace Ct N
- 19117 E 14th St N
- 19201 E 13th Terrace N
- 2100 N York St
- 1801 N Davidson Rd
- 1124 N Ponca Dr
- 18001 E 12th St N
- 2023 N Ethan Ln
- 1117 N Swope Dr
- 18100 E 11th Terrace Ct N
- 1700 N Lazy Branch Rd
- 1608 N Lazy Branch Rd
- 1606 N Lazy Branch Rd
- 1702 N Lazy Branch Rd
- 1611 N Lazy Branch Rd
- 1613 N Lazy Branch Rd
- 1701 N Lazy Branch Rd
- 1604 N Lazy Branch Rd
- 1704 N Lazy Branch Rd
- 1607 N Lazy Branch Rd
- 1611 N Ponca Dr
- 1609 N Ponca Dr
- 1703 N Lazy Branch Rd
- 1701 N Ponca Dr
- 1607 N Ponca Dr
- 1605 N Lazy Branch Rd
- 1706 N Lazy Branch Rd
- 1703 N Ponca Dr
- 1605 N Ponca Dr
- 1610 S Concord Ct