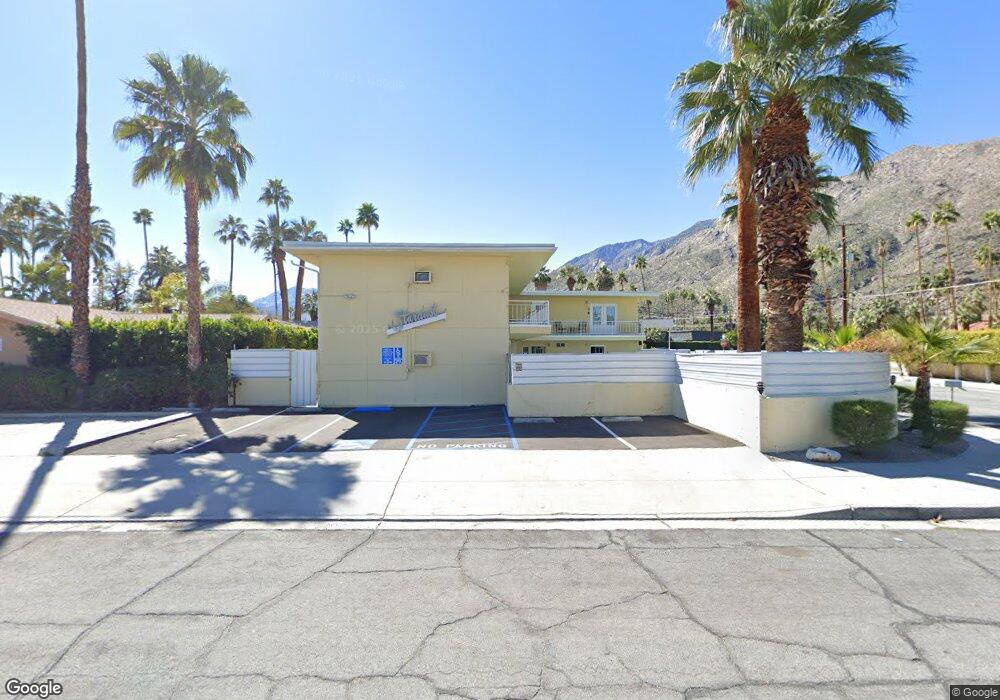
1610 S Via Entrada Unit 10 Palm Springs, CA 92264
Tahquitz River Estates NeighborhoodEstimated Value: $1,787,167
--
Bed
--
Bath
3,654
Sq Ft
$489/Sq Ft
Est. Value
About This Home
This home is located at 1610 S Via Entrada Unit 10, Palm Springs, CA 92264 and is currently estimated at $1,787,167, approximately $489 per square foot. 1610 S Via Entrada Unit 10 is a home located in Riverside County with nearby schools including Cahuilla Elementary School, Raymond Cree Middle School, and Palm Springs High School.
Ownership History
Date
Name
Owned For
Owner Type
Purchase Details
Closed on
Dec 20, 2019
Sold by
M A O R I Llc
Bought by
Spry Timothy and Spry Jessica
Current Estimated Value
Purchase Details
Closed on
Jul 8, 2015
Sold by
Aims International Llc
Bought by
M A O R I Llc
Home Financials for this Owner
Home Financials are based on the most recent Mortgage that was taken out on this home.
Original Mortgage
$650,000
Interest Rate
3.97%
Mortgage Type
Seller Take Back
Purchase Details
Closed on
Dec 28, 2012
Sold by
Kathuria Chand B
Bought by
Aims International Llc
Purchase Details
Closed on
May 6, 1998
Sold by
Anderson and Marsha
Bought by
Kathuria Chand B
Home Financials for this Owner
Home Financials are based on the most recent Mortgage that was taken out on this home.
Original Mortgage
$210,000
Interest Rate
6.9%
Mortgage Type
Commercial
Create a Home Valuation Report for This Property
The Home Valuation Report is an in-depth analysis detailing your home's value as well as a comparison with similar homes in the area
Home Values in the Area
Average Home Value in this Area
Purchase History
| Date | Buyer | Sale Price | Title Company |
|---|---|---|---|
| Spry Timothy | $1,100,000 | Equity Title | |
| M A O R I Llc | $940,000 | Chicago Title Company | |
| Aims International Llc | -- | None Available | |
| Kathuria Chand B | $300,000 | First American Title Co |
Source: Public Records
Mortgage History
| Date | Status | Borrower | Loan Amount |
|---|---|---|---|
| Previous Owner | M A O R I Llc | $650,000 | |
| Previous Owner | Kathuria Chand B | $210,000 |
Source: Public Records
Tax History Compared to Growth
Tax History
| Year | Tax Paid | Tax Assessment Tax Assessment Total Assessment is a certain percentage of the fair market value that is determined by local assessors to be the total taxable value of land and additions on the property. | Land | Improvement |
|---|---|---|---|---|
| 2025 | $16,774 | $1,203,007 | $266,847 | $936,160 |
| 2023 | $16,774 | $1,156,294 | $256,486 | $899,808 |
| 2022 | $17,071 | $1,133,622 | $251,457 | $882,165 |
| 2021 | $16,767 | $1,111,395 | $246,527 | $864,868 |
| 2020 | $15,077 | $1,017,485 | $184,013 | $833,472 |
| 2019 | $14,853 | $997,535 | $180,405 | $817,130 |
| 2018 | $14,614 | $977,976 | $176,868 | $801,108 |
| 2017 | $14,431 | $958,800 | $173,400 | $785,400 |
| 2016 | $14,046 | $940,000 | $170,000 | $770,000 |
| 2015 | $6,925 | $391,306 | $70,427 | $320,879 |
| 2014 | $6,647 | $383,644 | $69,049 | $314,595 |
Source: Public Records
Map
Nearby Homes
- 1674 S Via Salida
- 470 E Avenida Olancha Unit 2
- 1450 S Via Soledad
- 1425 S Via Soledad
- 1529 S Calle Palo Fierro
- 442 E Avenida Palmera
- 8 Ridge Rd
- 495 E Twin Palms Dr
- 1560 S Calle Palo Fierro
- 248 Lei Dr
- 250 E Sonora Rd
- 111 Canyon Rock Rd
- 315 Kona Ln
- 313 Kona Ln
- 0 Ridge Rd Unit 219131556PS
- 1230 Surrey Ln
- 743 E Twin Palms Dr
- 1861 S Palm Canyon Dr
- 1474 S Camino Real Unit 83
- 1472 S Camino Real
- 1610 S Vía Entrada
- 1610 S Vía Entrada Unit 10
- 310 E Palm Canyon Dr
- 350 E Palm Canyon Dr Unit 31
- 350 E Palm Canyon Dr Unit 20
- 350 E Palm Canyon Dr Unit 6
- 350 E Palm Canyon Dr Unit 28
- 350 E Palm Canyon Dr Unit 8
- 350 E Palm Canyon Dr
- 340 Avenida Ortega
- 273 Avenida Ortega Unit 5
- 273 Avenida Ortega Unit 2
- 273 Avenida Ortega
- 276 E Palm Canyon Dr
- 292 E Palm Canyon Dr
- 1673 S Via Salida
- 250 E Palm Canyon Dr
- 380 Avenida Ortega
- 1632 S Vía Entrada
- 1632 S Via Entrada