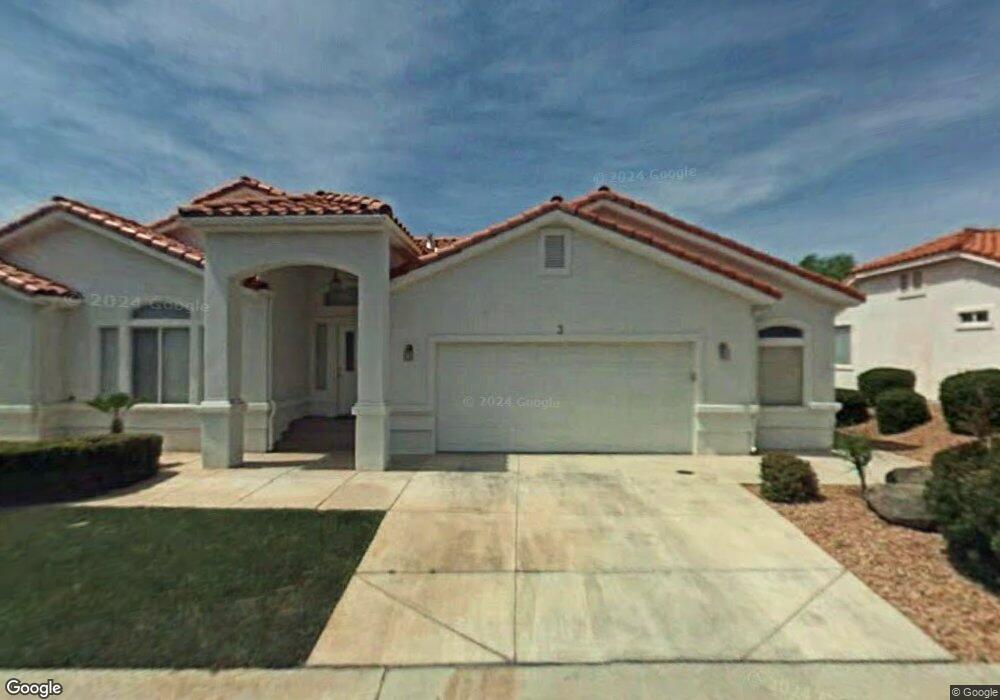
1610 W 100 N Unit 74 Saint George, UT 84770
Estimated Value: $492,000 - $504,000
3
Beds
3
Baths
2,445
Sq Ft
$203/Sq Ft
Est. Value
About This Home
This home is located at 1610 W 100 N Unit 74, Saint George, UT 84770 and is currently estimated at $497,093, approximately $203 per square foot. 1610 W 100 N Unit 74 is a home located in Washington County with nearby schools including Sunset School, Snow Canyon Middle School, and Lava Ridge Intermediate School.
Ownership History
Date
Name
Owned For
Owner Type
Purchase Details
Closed on
Dec 11, 2024
Sold by
Haslem Joseph Verl
Bought by
Haslem Joseph Verl and Haslem Johanna D
Current Estimated Value
Home Financials for this Owner
Home Financials are based on the most recent Mortgage that was taken out on this home.
Original Mortgage
$390,000
Outstanding Balance
$386,891
Interest Rate
6.72%
Mortgage Type
New Conventional
Estimated Equity
$110,202
Purchase Details
Closed on
Dec 10, 2024
Sold by
Helen Mcvey-Mann Revocable Trust and Mcvey Thomas J
Bought by
Haslem Joseph Verl
Home Financials for this Owner
Home Financials are based on the most recent Mortgage that was taken out on this home.
Original Mortgage
$390,000
Outstanding Balance
$386,891
Interest Rate
6.72%
Mortgage Type
New Conventional
Estimated Equity
$110,202
Purchase Details
Closed on
Sep 17, 2024
Sold by
Mcvey-Mann Helen
Bought by
Helen Mcvey-Mann Revocable Living Trust and Mcvey-Mann
Create a Home Valuation Report for This Property
The Home Valuation Report is an in-depth analysis detailing your home's value as well as a comparison with similar homes in the area
Home Values in the Area
Average Home Value in this Area
Purchase History
| Date | Buyer | Sale Price | Title Company |
|---|---|---|---|
| Haslem Joseph Verl | -- | -- | |
| Haslem Joseph Verl | -- | Metro National Title | |
| Helen Mcvey-Mann Revocable Living Trust | -- | -- |
Source: Public Records
Mortgage History
| Date | Status | Borrower | Loan Amount |
|---|---|---|---|
| Open | Haslem Joseph Verl | $390,000 |
Source: Public Records
Tax History Compared to Growth
Tax History
| Year | Tax Paid | Tax Assessment Tax Assessment Total Assessment is a certain percentage of the fair market value that is determined by local assessors to be the total taxable value of land and additions on the property. | Land | Improvement |
|---|---|---|---|---|
| 2025 | $1,832 | $491,100 | $95,000 | $396,100 |
| 2023 | $1,808 | $270,105 | $46,750 | $223,355 |
| 2022 | $1,926 | $270,655 | $46,750 | $223,905 |
| 2021 | $1,913 | $400,900 | $65,000 | $335,900 |
| 2020 | $1,648 | $325,200 | $65,000 | $260,200 |
| 2019 | $1,792 | $345,500 | $65,000 | $280,500 |
| 2018 | $1,728 | $172,040 | $0 | $0 |
| 2017 | $1,634 | $157,905 | $0 | $0 |
| 2016 | $1,693 | $151,305 | $0 | $0 |
| 2015 | $1,677 | $143,770 | $0 | $0 |
| 2014 | $1,723 | $148,720 | $0 | $0 |
Source: Public Records
Map
Nearby Homes
- 1610 W 100 N Unit 10
- 1610 W 100 N Unit 82
- 1610 W 100 N Unit 44
- 1610 W 100 N Unit 82
- 1610 W 100 N Unit 29
- 1610 W 100 N Unit 44
- 1610 W 100 N Unit 29
- 1610 W 100 N Unit 10
- 39 N Valley View Dr Unit 58
- 39 N Valley View Dr Unit 99
- 39 N Valley View Dr Unit 42
- 39 N Valley View Dr Unit 81
- 39 N Valley View Dr Unit 71
- 41 S Chalon Cir
- 78 S Villa Franche Cir
- 1730 W Stonebridge Dr Unit 19
- 1730 W Stonebridge Dr Unit 25
- 265 N Dixie Dr Unit 29
- 265 N Dixie Dr Unit 97
- 1858 W 10 N
- 1610 W 100 N Unit 9
- 1610 W 100 N Unit 8
- 1610 W 100 N Unit 77
- 1610 W 100 N Unit 76
- 1610 W 100 N Unit 75
- 1610 W 100 N Unit 73
- 1610 W 100 N Unit 72
- 1610 W 100 N Unit 71
- 1610 W 100 N Unit 7
- 1610 W 100 N Unit 68
- 1610 W 100 N Unit 67
- 1610 W 100 N Unit 66
- 1610 W 100 N Unit 65
- 1610 W 100 N Unit 64
- 1610 W 100 N Unit 63
- 1610 W 100 N Unit 62
- 1610 W 100 N Unit 61
- 1610 W 100 N Unit 60
- 1610 W 100 N Unit 59
- 1610 W 100 N Unit 58