Estimated Value: $942,051 - $987,000
5
Beds
5
Baths
3,907
Sq Ft
$244/Sq Ft
Est. Value
About This Home
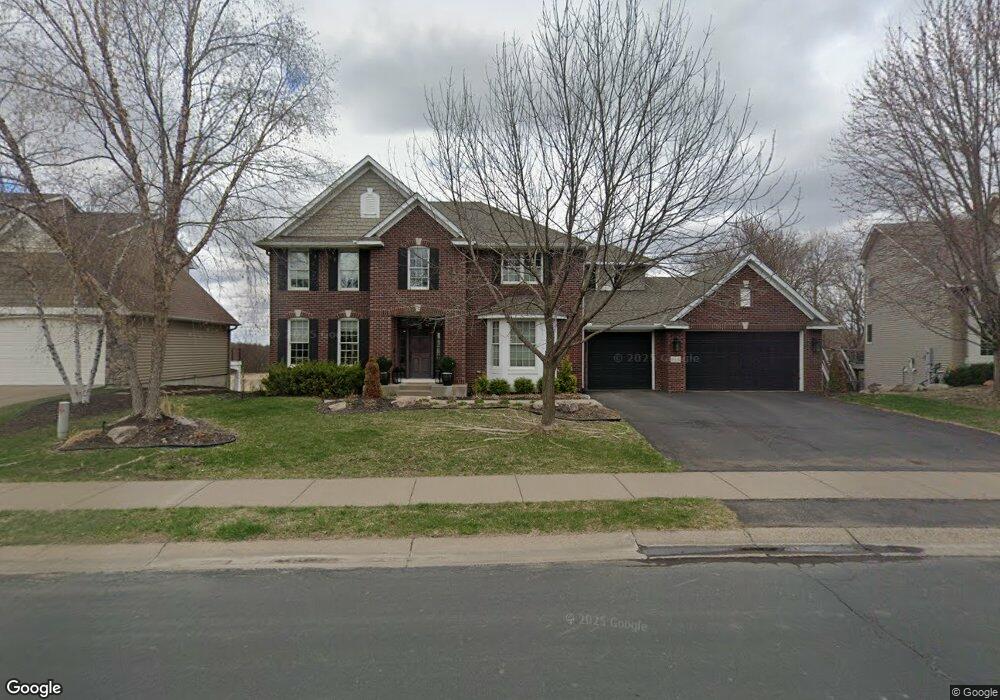
This home is located at 16102 73rd Place N, Osseo, MN 55311 and is currently estimated at $954,763, approximately $244 per square foot. 16102 73rd Place N is a home located in Hennepin County with nearby schools including Basswood Elementary School, Maple Grove Middle School, and Maple Grove Senior High School.
Ownership History
Date
Name
Owned For
Owner Type
Purchase Details
Closed on
Apr 14, 2020
Sold by
Peters Ryan D and Peters Natalie J
Bought by
Peters Ryan D
Current Estimated Value
Home Financials for this Owner
Home Financials are based on the most recent Mortgage that was taken out on this home.
Original Mortgage
$348,000
Outstanding Balance
$296,633
Interest Rate
3.6%
Mortgage Type
New Conventional
Estimated Equity
$658,130
Purchase Details
Closed on
Jul 28, 2011
Sold by
Stundahl Daren S and Stundahl Amy G
Bought by
Peters Ryan D and Peters Natalie J
Home Financials for this Owner
Home Financials are based on the most recent Mortgage that was taken out on this home.
Original Mortgage
$90,000
Interest Rate
4.53%
Mortgage Type
Credit Line Revolving
Purchase Details
Closed on
Jul 30, 2007
Sold by
Us Home Corp
Bought by
Stundahl Daren S and Stundahl Amy G
Create a Home Valuation Report for This Property
The Home Valuation Report is an in-depth analysis detailing your home's value as well as a comparison with similar homes in the area
Home Values in the Area
Average Home Value in this Area
Purchase History
| Date | Buyer | Sale Price | Title Company |
|---|---|---|---|
| Peters Ryan D | $500 | Servicelink | |
| Peters Ryan D | $658,000 | Signature Title Midwest Serv | |
| Peters Ryan D | $658,000 | -- | |
| Stundahl Daren S | $765,990 | -- |
Source: Public Records
Mortgage History
| Date | Status | Borrower | Loan Amount |
|---|---|---|---|
| Open | Peters Ryan D | $348,000 | |
| Previous Owner | Peters Ryan D | $90,000 | |
| Previous Owner | Peters Ryan D | $417,000 |
Source: Public Records
Tax History Compared to Growth
Tax History
| Year | Tax Paid | Tax Assessment Tax Assessment Total Assessment is a certain percentage of the fair market value that is determined by local assessors to be the total taxable value of land and additions on the property. | Land | Improvement |
|---|---|---|---|---|
| 2024 | $11,394 | $864,000 | $203,200 | $660,800 |
| 2023 | $10,929 | $861,000 | $199,500 | $661,500 |
| 2022 | $9,154 | $899,300 | $219,900 | $679,400 |
| 2021 | $9,074 | $710,900 | $136,400 | $574,500 |
| 2020 | $10,293 | $695,500 | $134,500 | $561,000 |
| 2019 | $10,347 | $743,100 | $134,700 | $608,400 |
| 2018 | $10,281 | $709,400 | $125,500 | $583,900 |
| 2017 | $9,502 | $623,700 | $162,000 | $461,700 |
| 2016 | $9,487 | $615,200 | $162,000 | $453,200 |
| 2015 | $9,241 | $587,400 | $142,000 | $445,400 |
| 2014 | -- | $580,900 | $175,000 | $405,900 |
Source: Public Records
Map
Nearby Homes
- 15770 73rd Place N
- 16236 70th Place N
- 7261 Quantico Ln N
- 7099 Weston Ln N
- 7094 Weston Ln N
- 7082 Weston Ln N
- 7244 Quantico Ln N
- 16322 70th Ave N Unit 204
- 16314 70th Ave N
- 7788 Everest Ct N
- 7585 Lanewood Ln N
- 16888 78th Ave N
- 7870 Ranchview Ln N
- 7720 Niagara Ln N
- 7453 Mariner Dr
- 16824 79th Ave N
- 17225 72nd Ave N Unit 2001
- 17390 72nd Ave N Unit 1301
- 16878 79th Place N
- 6848 Polaris Ln N
- 16102 73rd Place N
- 16124 73rd Place N
- 16060 73rd Place N
- 7348 Xene Ln N
- 16166 73rd Place N
- 7342 Xene Ln N
- 16198 73rd Place N
- 16198 73rd Place N
- 7336 Xene Ln N
- 16154 73rd Cir N
- 16114 73rd Cir N
- 16104 73rd Cir N
- 16210 73rd Place N
- 16222 16222 73rd-Place-n
- 7330 Xene Ln N
- 16184 73rd Cir N
- 16222 73rd Place N
- 16222 73rd Place N
- 16261 73rd Place N
- 7324 Xene Ln N