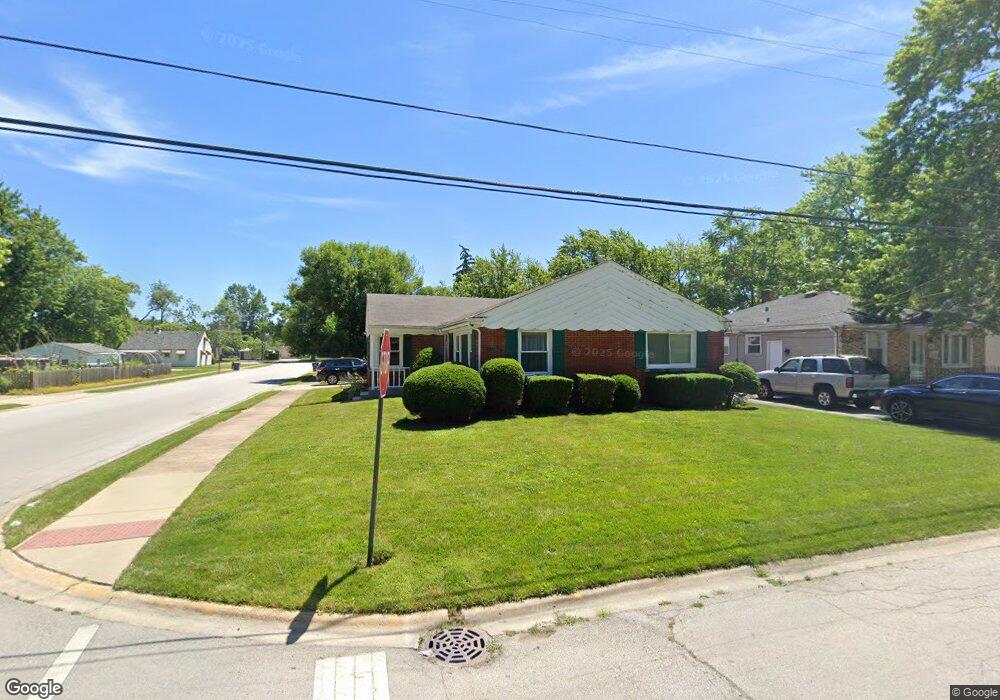
16103 Evans Ave South Holland, IL 60473
South River-Cook County NeighborhoodEstimated Value: $199,000 - $242,000
3
Beds
1
Bath
1,346
Sq Ft
$164/Sq Ft
Est. Value
About This Home
This home is located at 16103 Evans Ave, South Holland, IL 60473 and is currently estimated at $220,144, approximately $163 per square foot. 16103 Evans Ave is a home located in Cook County with nearby schools including Taft School, Eisenhower School, and Coolidge Middle School.
Ownership History
Date
Name
Owned For
Owner Type
Purchase Details
Closed on
Dec 4, 2009
Sold by
Moore Phillip
Bought by
Kimmons Murry E
Current Estimated Value
Home Financials for this Owner
Home Financials are based on the most recent Mortgage that was taken out on this home.
Original Mortgage
$153,664
Outstanding Balance
$101,303
Interest Rate
5.11%
Mortgage Type
FHA
Estimated Equity
$118,841
Purchase Details
Closed on
Feb 23, 2006
Sold by
Hud
Bought by
Moore Phillip
Home Financials for this Owner
Home Financials are based on the most recent Mortgage that was taken out on this home.
Original Mortgage
$118,804
Interest Rate
6.22%
Mortgage Type
New Conventional
Purchase Details
Closed on
Oct 25, 2004
Sold by
Thomas
Bought by
Hud
Purchase Details
Closed on
Mar 20, 2002
Sold by
Vanwyhe Jerold Glen and Vanwyhe Sharon Lynn
Bought by
Haywood Dina M and Thomas Jemal A
Home Financials for this Owner
Home Financials are based on the most recent Mortgage that was taken out on this home.
Original Mortgage
$135,375
Interest Rate
6.95%
Mortgage Type
FHA
Create a Home Valuation Report for This Property
The Home Valuation Report is an in-depth analysis detailing your home's value as well as a comparison with similar homes in the area
Home Values in the Area
Average Home Value in this Area
Purchase History
| Date | Buyer | Sale Price | Title Company |
|---|---|---|---|
| Kimmons Murry E | $156,500 | None Available | |
| Moore Phillip | -- | Stewart Title Of Illinois | |
| Hud | -- | -- | |
| Haywood Dina M | $137,500 | -- |
Source: Public Records
Mortgage History
| Date | Status | Borrower | Loan Amount |
|---|---|---|---|
| Open | Kimmons Murry E | $153,664 | |
| Previous Owner | Moore Phillip | $118,804 | |
| Previous Owner | Haywood Dina M | $135,375 |
Source: Public Records
Tax History Compared to Growth
Tax History
| Year | Tax Paid | Tax Assessment Tax Assessment Total Assessment is a certain percentage of the fair market value that is determined by local assessors to be the total taxable value of land and additions on the property. | Land | Improvement |
|---|---|---|---|---|
| 2024 | $7,788 | $20,000 | $4,235 | $15,765 |
| 2023 | $4,766 | $20,000 | $4,235 | $15,765 |
| 2022 | $4,766 | $11,372 | $3,630 | $7,742 |
| 2021 | $4,767 | $11,371 | $3,629 | $7,742 |
| 2020 | $4,617 | $11,371 | $3,629 | $7,742 |
| 2019 | $4,985 | $11,966 | $3,226 | $8,740 |
| 2018 | $4,865 | $11,966 | $3,226 | $8,740 |
| 2017 | $4,759 | $11,966 | $3,226 | $8,740 |
| 2016 | $4,504 | $10,801 | $3,024 | $7,777 |
| 2015 | $4,300 | $10,801 | $3,024 | $7,777 |
| 2014 | $4,235 | $10,801 | $3,024 | $7,777 |
| 2013 | $4,724 | $12,367 | $3,024 | $9,343 |
Source: Public Records
Map
Nearby Homes
- 16037 Evans Ave
- 634 E 161st St
- 16007 Cottage Grove Ave
- 609 E 160th Place
- 16083 School St
- 644 E 162nd St
- 618 E 159th Place
- 16015 Drexel Ave
- 907 E 162nd Place
- 15966 Debbie Ln
- 519 E 161st St
- 521 E 161st Place
- 664 E 163rd St
- 509 E 161st Place
- 15760 Church Dr
- 16211 Joyce Cir
- 913 E 162nd Place
- 838 E 163rd Place
- 16265 Drexel Ave
- 1012 E 159th Place
- 16107 Evans Ave
- 16111 Evans Ave
- 16061 Evans Ave
- 16117 Evans Ave
- 16106 Cottage Grove Ave
- 677 E 161st St
- 16062 Cottage Grove Ave
- 16053 Evans Ave
- 16110 Cottage Grove Ave
- 16116 Evans Ave
- 16123 Evans Ave
- 16118 Cottage Grove Ave
- 674 E 161st St
- 16120 Evans Ave
- 663 E 161st St
- 670 East Ct
- 16122 Cottage Grove Ave
- 16129 Evans Ave
- 16126 Cottage Grove Ave
- 16048 Cottage Grove Ave