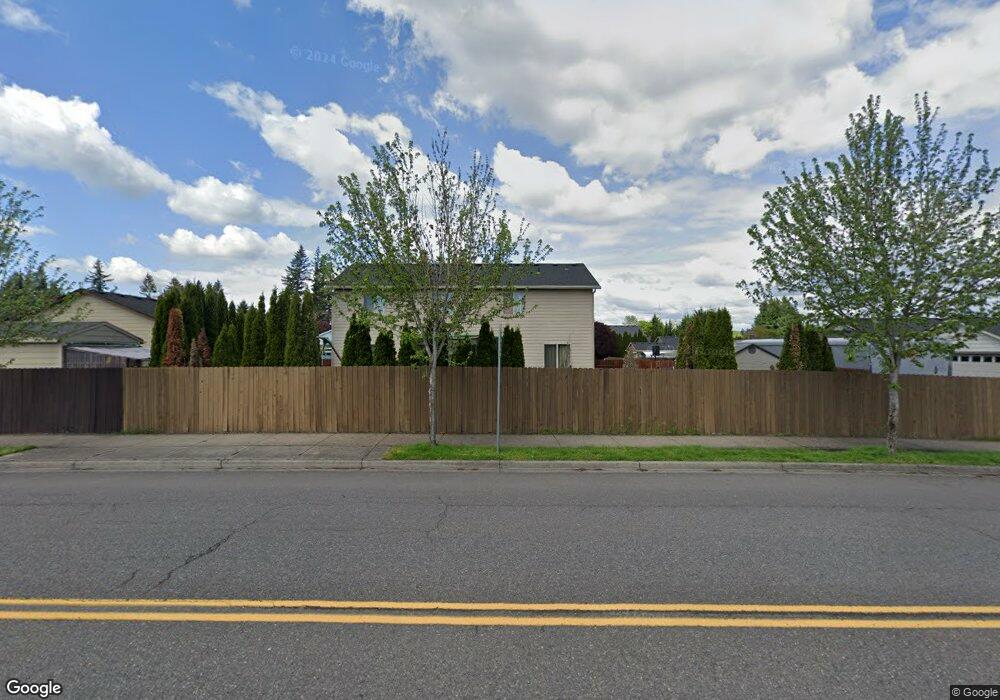
16104 NE 79th Cir Vancouver, WA 98682
Orchards Area NeighborhoodEstimated Value: $449,000 - $508,000
3
Beds
2
Baths
1,132
Sq Ft
$412/Sq Ft
Est. Value
About This Home
This home is located at 16104 NE 79th Cir, Vancouver, WA 98682 and is currently estimated at $466,156, approximately $411 per square foot. 16104 NE 79th Cir is a home located in Clark County with nearby schools including Pioneer Elementary School, Frontier Middle School, and Heritage High School.
Ownership History
Date
Name
Owned For
Owner Type
Purchase Details
Closed on
Dec 14, 2015
Sold by
Noble Ryan and Noble Chelsie
Bought by
Phong Melissa C
Current Estimated Value
Home Financials for this Owner
Home Financials are based on the most recent Mortgage that was taken out on this home.
Original Mortgage
$210,229
Outstanding Balance
$166,753
Interest Rate
3.96%
Mortgage Type
New Conventional
Estimated Equity
$299,403
Purchase Details
Closed on
Jun 26, 2009
Sold by
Aho Construction I Inc
Bought by
Noble Ryan E and Looker Chelsie L
Home Financials for this Owner
Home Financials are based on the most recent Mortgage that was taken out on this home.
Original Mortgage
$187,677
Interest Rate
4.83%
Mortgage Type
FHA
Purchase Details
Closed on
May 19, 2009
Sold by
Homestreet Bank
Bought by
Aho Construction I Inc
Home Financials for this Owner
Home Financials are based on the most recent Mortgage that was taken out on this home.
Original Mortgage
$187,677
Interest Rate
4.83%
Mortgage Type
FHA
Create a Home Valuation Report for This Property
The Home Valuation Report is an in-depth analysis detailing your home's value as well as a comparison with similar homes in the area
Home Values in the Area
Average Home Value in this Area
Purchase History
| Date | Buyer | Sale Price | Title Company |
|---|---|---|---|
| Phong Melissa C | $230,000 | Cascade Title Company | |
| Noble Ryan E | $191,329 | Stewart Title | |
| Aho Construction I Inc | $67,500 | Stewart Title |
Source: Public Records
Mortgage History
| Date | Status | Borrower | Loan Amount |
|---|---|---|---|
| Open | Phong Melissa C | $210,229 | |
| Previous Owner | Noble Ryan E | $187,677 | |
| Previous Owner | Aho Construction I Inc | $133,900 |
Source: Public Records
Tax History Compared to Growth
Tax History
| Year | Tax Paid | Tax Assessment Tax Assessment Total Assessment is a certain percentage of the fair market value that is determined by local assessors to be the total taxable value of land and additions on the property. | Land | Improvement |
|---|---|---|---|---|
| 2025 | $4,094 | $400,880 | $171,600 | $229,280 |
| 2024 | $3,939 | $401,945 | $171,600 | $230,345 |
| 2023 | $3,845 | $406,397 | $171,600 | $234,797 |
| 2022 | $3,523 | $390,547 | $171,600 | $218,947 |
| 2021 | $3,340 | $333,150 | $145,600 | $187,550 |
| 2020 | $3,172 | $297,095 | $130,000 | $167,095 |
| 2019 | $2,900 | $283,186 | $123,750 | $159,436 |
| 2018 | $3,032 | $275,887 | $0 | $0 |
| 2017 | $2,799 | $233,080 | $0 | $0 |
| 2016 | $2,644 | $224,369 | $0 | $0 |
| 2015 | $2,527 | $197,108 | $0 | $0 |
| 2014 | -- | $179,129 | $0 | $0 |
| 2013 | -- | $158,944 | $0 | $0 |
Source: Public Records
Map
Nearby Homes
- 16301 NE 77th Cir
- 16600 NE 80th St
- 7811 NE 167th Ave
- 8101 NE 167th Ave
- 8311 NE 156th Ave
- 15810 NE 72nd St
- 16705 NE 83rd St
- 15408 NE 76th St
- 8211 NE 168th Place
- 7817 NE 152nd Ave
- 8208 NE 170th Ave
- 17013 NE 81st St
- 7813 NE 152nd Ave
- 17011 NE 82nd St
- 17015 NE 82nd St
- 17014 NE 82nd St
- 15212 NE 74th St
- 8015 NE 172nd Ave
- 8103 NE 172nd Ave
- 16319 NE 68th St
- 16100 NE 79th Cir
- 16120 NE 79th Cir
- 7900 NE 162nd Ave
- 16014 NE 79th Cir
- 16124 NE 79th Cir
- 16107 NE 79th Cir
- 16101 NE 79th Way
- 16115 NE 79th Cir
- 16103 NE 79th Cir
- 16017 NE 79th Way
- 16109 NE 79th Way
- 16013 NE 79th Cir
- 7907 NE 160th Ct
- 16010 NE 79th Cir
- 16111 NE 79th Cir
- 16011 NE 79th Way
- 16009 NE 79th Cir
- 16102 NE 79th Way
- 15915 NE 79th St
- 7914 NE 162nd Ave