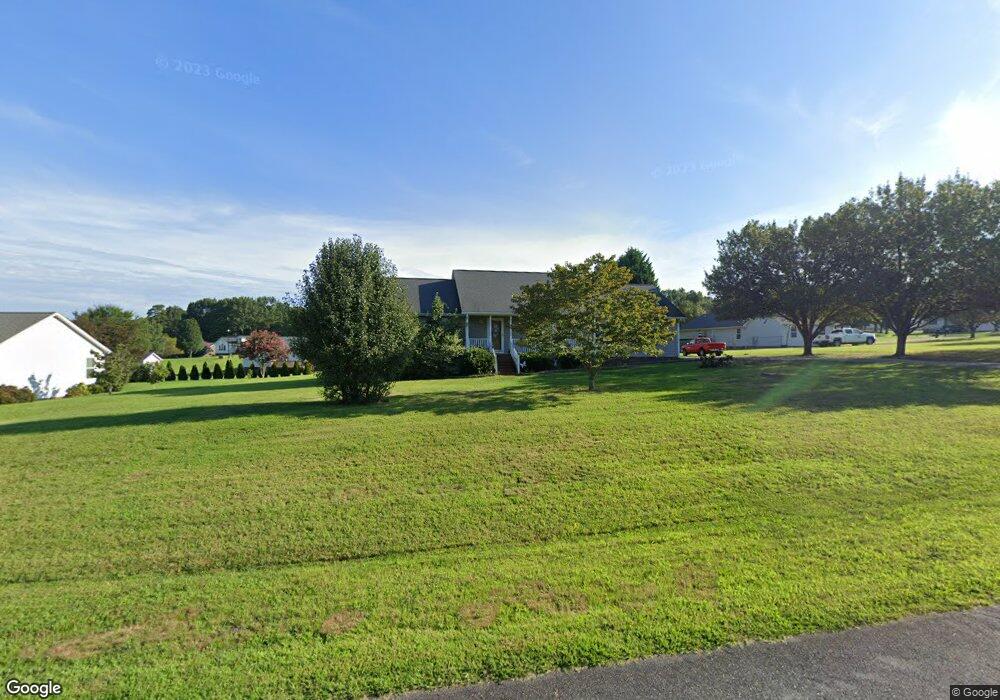
1611 Beverly Ln Lincolnton, NC 28092
Estimated Value: $284,000 - $352,000
3
Beds
2
Baths
1,426
Sq Ft
$229/Sq Ft
Est. Value
About This Home
This home is located at 1611 Beverly Ln, Lincolnton, NC 28092 and is currently estimated at $326,066, approximately $228 per square foot. 1611 Beverly Ln is a home located in Lincoln County with nearby schools including G.E. Massey Elementary School, Lincolnton Middle School, and Lincolnton High School.
Ownership History
Date
Name
Owned For
Owner Type
Purchase Details
Closed on
Nov 23, 2015
Sold by
Alley Rusty L and Alley Elizabeth B
Bought by
Lane Jason N and Manis Tiffany A
Current Estimated Value
Home Financials for this Owner
Home Financials are based on the most recent Mortgage that was taken out on this home.
Original Mortgage
$150,350
Outstanding Balance
$118,217
Interest Rate
3.78%
Mortgage Type
New Conventional
Estimated Equity
$207,849
Purchase Details
Closed on
Sep 9, 2011
Sold by
Kalberer Robert and Kalberer Carolyn
Bought by
Alley Rusty L and Alley Elizabeth B
Home Financials for this Owner
Home Financials are based on the most recent Mortgage that was taken out on this home.
Original Mortgage
$146,114
Interest Rate
4.55%
Mortgage Type
New Conventional
Purchase Details
Closed on
Jan 28, 2011
Sold by
Kalberer Robert
Bought by
Kalberer Robert and Kalberer Carolyn
Purchase Details
Closed on
Mar 30, 2005
Sold by
Kalberer Carolyn
Bought by
Kalberer Robert
Purchase Details
Closed on
Aug 30, 2002
Bought by
Kalberer Walter R and Kalberer Carolyn M
Purchase Details
Closed on
Jan 21, 1998
Bought by
Ballard Chad Dale and Brandi Lewis B
Create a Home Valuation Report for This Property
The Home Valuation Report is an in-depth analysis detailing your home's value as well as a comparison with similar homes in the area
Home Values in the Area
Average Home Value in this Area
Purchase History
| Date | Buyer | Sale Price | Title Company |
|---|---|---|---|
| Lane Jason N | $155,000 | None Available | |
| Alley Rusty L | $141,000 | None Available | |
| Kalberer Robert | -- | None Available | |
| Kalberer Robert | -- | None Available | |
| Kalberer Walter R | $117,000 | -- | |
| Ballard Chad Dale | $10,500 | -- |
Source: Public Records
Mortgage History
| Date | Status | Borrower | Loan Amount |
|---|---|---|---|
| Open | Lane Jason N | $150,350 | |
| Previous Owner | Alley Rusty L | $146,114 |
Source: Public Records
Tax History Compared to Growth
Tax History
| Year | Tax Paid | Tax Assessment Tax Assessment Total Assessment is a certain percentage of the fair market value that is determined by local assessors to be the total taxable value of land and additions on the property. | Land | Improvement |
|---|---|---|---|---|
| 2025 | $1,620 | $237,198 | $33,000 | $204,198 |
| 2024 | $1,600 | $237,198 | $33,000 | $204,198 |
| 2023 | $1,595 | $237,198 | $33,000 | $204,198 |
| 2022 | $1,263 | $154,256 | $26,000 | $128,256 |
| 2021 | $1,263 | $154,256 | $26,000 | $128,256 |
| 2020 | $1,117 | $154,256 | $26,000 | $128,256 |
| 2019 | $1,086 | $154,256 | $26,000 | $128,256 |
| 2018 | $1,030 | $129,708 | $24,000 | $105,708 |
| 2017 | $922 | $129,708 | $24,000 | $105,708 |
| 2016 | $922 | $129,708 | $24,000 | $105,708 |
| 2015 | $990 | $129,708 | $24,000 | $105,708 |
| 2014 | $992 | $131,630 | $24,000 | $107,630 |
Source: Public Records
Map
Nearby Homes
- 2815 Highland Dr
- 00 Turner St
- 312 Shady Ln
- 741 Sunridge Dr
- 115 Turner St
- 00 Walker Branch Rd
- 1156 Walker Branch Rd
- 1235 Wilma Sigmon Rd
- 401 Little St
- 1818 Maple Ln
- 2546 N Carolina Highway 150
- 1681 Woolie Rd
- 2384 Abby Ave
- 1405 Willow Ridge Rd
- 000 Curveview Rd
- Lot 49 Hares Way
- Lot 51 Hares Way
- Lot 50 Hares Way
- 2515 Myra Ln
- 0 Wilma Sigmon Rd Unit A CAR4306088
- 1595 Beverly Ln
- 1645 Beverly Ln
- 1578 Angela Ct
- 1606 Beverly Ln
- 1592 Beverly Ln
- 1626 Beverly Ln
- 1583 Beverly Ln
- 1618 Beverly Ln
- 00 Angela Ct Unit 55
- 1628 Beverly Ln
- 1644 Beverly Ln
- 1554 Angela Ct
- 1654 Beverly Ln
- 1585 Angela Ct
- 1575 Beverly Ln
- 1575 Angela Ct
- 1595 Angela Ct
- 1557 Angela Ct
- 1607 Angela Ct
- 1636 Angela Ct