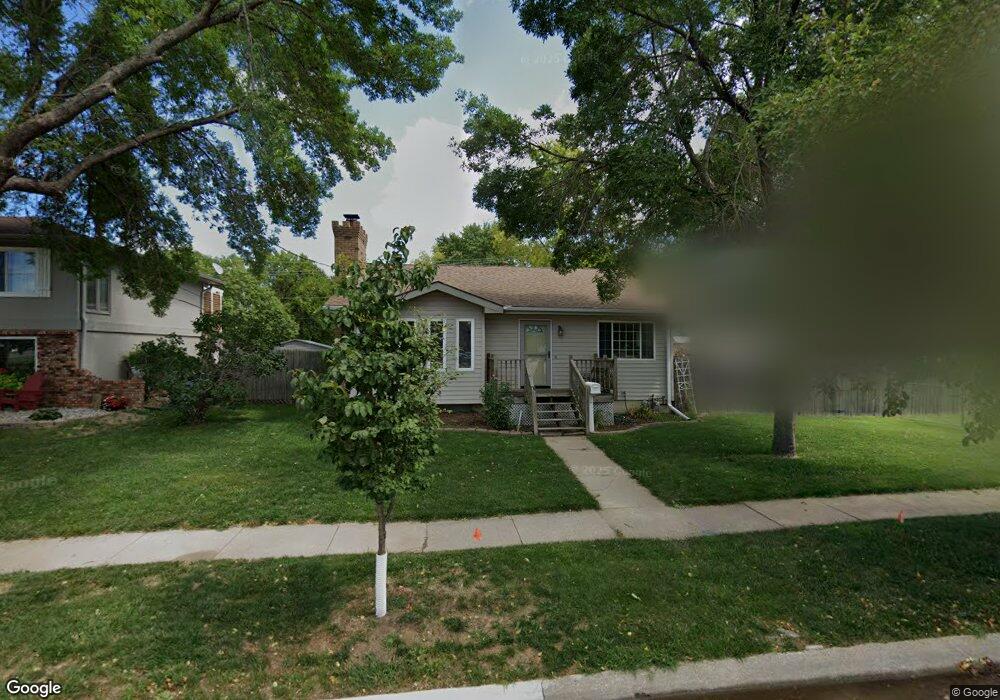
1611 S 11th St Council Bluffs, IA 51501
The South End NeighborhoodEstimated Value: $224,482 - $246,000
3
Beds
2
Baths
1,362
Sq Ft
$172/Sq Ft
Est. Value
About This Home
This home is located at 1611 S 11th St, Council Bluffs, IA 51501 and is currently estimated at $234,121, approximately $171 per square foot. 1611 S 11th St is a home located in Pottawattamie County with nearby schools including Longfellow Elementary School, Gerald W. Kirn Middle School, and Abraham Lincoln High School.
Ownership History
Date
Name
Owned For
Owner Type
Purchase Details
Closed on
Apr 5, 2011
Sold by
Moser Cheryl Lynn
Bought by
Caligur Steve A
Current Estimated Value
Home Financials for this Owner
Home Financials are based on the most recent Mortgage that was taken out on this home.
Original Mortgage
$108,186
Outstanding Balance
$5,864
Interest Rate
4.93%
Mortgage Type
FHA
Estimated Equity
$228,257
Purchase Details
Closed on
Oct 26, 2005
Sold by
Moser Dale J and Moser Cheryl Lynn
Bought by
Moser Dale J and Moser Cheryl Lynn
Home Financials for this Owner
Home Financials are based on the most recent Mortgage that was taken out on this home.
Original Mortgage
$98,000
Interest Rate
6.17%
Mortgage Type
New Conventional
Create a Home Valuation Report for This Property
The Home Valuation Report is an in-depth analysis detailing your home's value as well as a comparison with similar homes in the area
Home Values in the Area
Average Home Value in this Area
Purchase History
| Date | Buyer | Sale Price | Title Company |
|---|---|---|---|
| Caligur Steve A | $111,000 | None Available | |
| Moser Cheryl Lynn | -- | None Available | |
| Moser Dale J | -- | None Available |
Source: Public Records
Mortgage History
| Date | Status | Borrower | Loan Amount |
|---|---|---|---|
| Open | Moser Cheryl Lynn | $108,186 | |
| Previous Owner | Moser Dale J | $98,000 |
Source: Public Records
Tax History Compared to Growth
Tax History
| Year | Tax Paid | Tax Assessment Tax Assessment Total Assessment is a certain percentage of the fair market value that is determined by local assessors to be the total taxable value of land and additions on the property. | Land | Improvement |
|---|---|---|---|---|
| 2025 | $3,212 | $201,300 | $30,700 | $170,600 |
| 2024 | $3,212 | $183,400 | $26,700 | $156,700 |
| 2023 | $3,656 | $183,400 | $26,700 | $156,700 |
| 2022 | $3,674 | $156,600 | $21,800 | $134,800 |
| 2021 | $5,629 | $156,600 | $21,800 | $134,800 |
| 2020 | $3,204 | $156,600 | $21,800 | $134,800 |
| 2019 | $3,126 | $129,000 | $11,503 | $117,497 |
| 2018 | $3,066 | $121,581 | $11,503 | $110,078 |
| 2017 | $3,100 | $121,581 | $11,503 | $110,078 |
| 2015 | $3,032 | $121,581 | $11,503 | $110,078 |
| 2014 | $3,036 | $121,581 | $11,503 | $110,078 |
Source: Public Records
Map
Nearby Homes