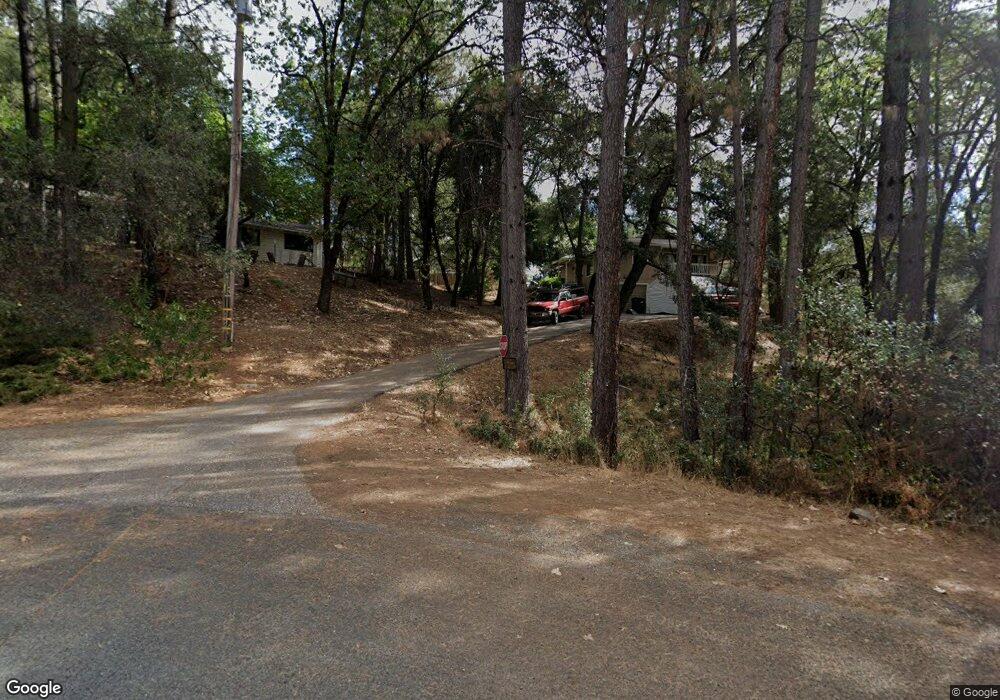
16111 Gary Way Grass Valley, CA 95949
Estimated Value: $729,000 - $890,000
4
Beds
3
Baths
3,410
Sq Ft
$240/Sq Ft
Est. Value
About This Home
This home is located at 16111 Gary Way, Grass Valley, CA 95949 and is currently estimated at $819,293, approximately $240 per square foot. 16111 Gary Way is a home located in Nevada County with nearby schools including Bell Hill Academy, Margaret G. Scotten Elementary School, and Lyman Gilmore Middle School.
Ownership History
Date
Name
Owned For
Owner Type
Purchase Details
Closed on
Mar 22, 2024
Sold by
Johnson Alan and Johnson Connie
Bought by
Johnson Alan
Current Estimated Value
Purchase Details
Closed on
Dec 9, 2019
Sold by
Johnson Alan R and Johnson Connie Vaughn
Bought by
Johnson Alan R and Johnson Connie Vaughn
Purchase Details
Closed on
Jun 22, 2010
Sold by
Warner Scott and Warner Katrina
Bought by
Johnson Alan R and Johnson Connie Vaughn
Purchase Details
Closed on
Apr 17, 2006
Sold by
Jones Terri E
Bought by
Warner Scott and Warner Katrina
Home Financials for this Owner
Home Financials are based on the most recent Mortgage that was taken out on this home.
Original Mortgage
$708,000
Interest Rate
6.5%
Mortgage Type
Fannie Mae Freddie Mac
Purchase Details
Closed on
Sep 3, 1997
Sold by
Robertson Frank D and Robertson Judith L
Bought by
Jones Terri E
Create a Home Valuation Report for This Property
The Home Valuation Report is an in-depth analysis detailing your home's value as well as a comparison with similar homes in the area
Home Values in the Area
Average Home Value in this Area
Purchase History
| Date | Buyer | Sale Price | Title Company |
|---|---|---|---|
| Johnson Alan | -- | First American Title | |
| Johnson Alan R | -- | None Available | |
| Johnson Alan R | $585,000 | First American Title Company | |
| Warner Scott | $885,000 | Placer Title Company | |
| Jones Terri E | $425,000 | California Land Title Co |
Source: Public Records
Mortgage History
| Date | Status | Borrower | Loan Amount |
|---|---|---|---|
| Previous Owner | Warner Scott | $708,000 |
Source: Public Records
Tax History Compared to Growth
Tax History
| Year | Tax Paid | Tax Assessment Tax Assessment Total Assessment is a certain percentage of the fair market value that is determined by local assessors to be the total taxable value of land and additions on the property. | Land | Improvement |
|---|---|---|---|---|
| 2025 | $6,339 | $755,116 | $225,885 | $529,231 |
| 2024 | $6,239 | $740,310 | $221,456 | $518,854 |
| 2023 | $6,239 | $725,795 | $217,114 | $508,681 |
| 2022 | $6,426 | $711,564 | $212,857 | $498,707 |
| 2021 | $7,608 | $697,613 | $208,684 | $488,929 |
| 2020 | $7,599 | $690,461 | $206,545 | $483,916 |
| 2019 | $7,283 | $676,924 | $202,496 | $474,428 |
| 2018 | $7,251 | $663,652 | $198,526 | $465,126 |
| 2017 | $6,962 | $650,640 | $194,634 | $456,006 |
| 2016 | $6,706 | $637,883 | $190,818 | $447,065 |
| 2015 | $6,609 | $628,302 | $187,952 | $440,350 |
| 2014 | $6,506 | $615,996 | $184,271 | $431,725 |
Source: Public Records
Map
Nearby Homes
- 16153 Janet Way
- 11425 Lower Circle Dr
- 11227 Edward Dr
- 15725 Carrie Dr
- 11173 Edward Dr
- 16465 Norlene Way
- 11575 Bernadine Ct
- 17059 Alioto Dr
- 11931 Alta Sierra Dr
- 10971 Juanita Ct
- 12015 Alta Sierra Dr
- 15690 Fay Rd
- 18875 Connie Dr
- 18759 Connie Dr
- 12044 Francis Dr
- 11818 Upper Circle Dr
- 16939 Norlene Way
- 11277 Alta Sierra Dr
- 16929 Lawrence Way
- 11508 Marilyn Ct
- 15168 Brewer Rd
- 15212 Brewer Rd
- 16201 Gary Way
- 16181 Gary Way
- 16137 Gary Way
- 16093 Gary Way
- 15258 Brewer Rd
- 16176 Gary Way
- 15203 Brewer Rd
- 15121 Tammy Way
- 16525 Joey Ct
- 11956 Tammy Way
- 16128 Gary Way
- 11478 Betty Way
- 15255 Brewer Rd
- 16522 Joey Ct
- 11932 Tammy Way
- 11957 Tammy Way
- 16100 Gary Way
- 15317 Brewer Rd