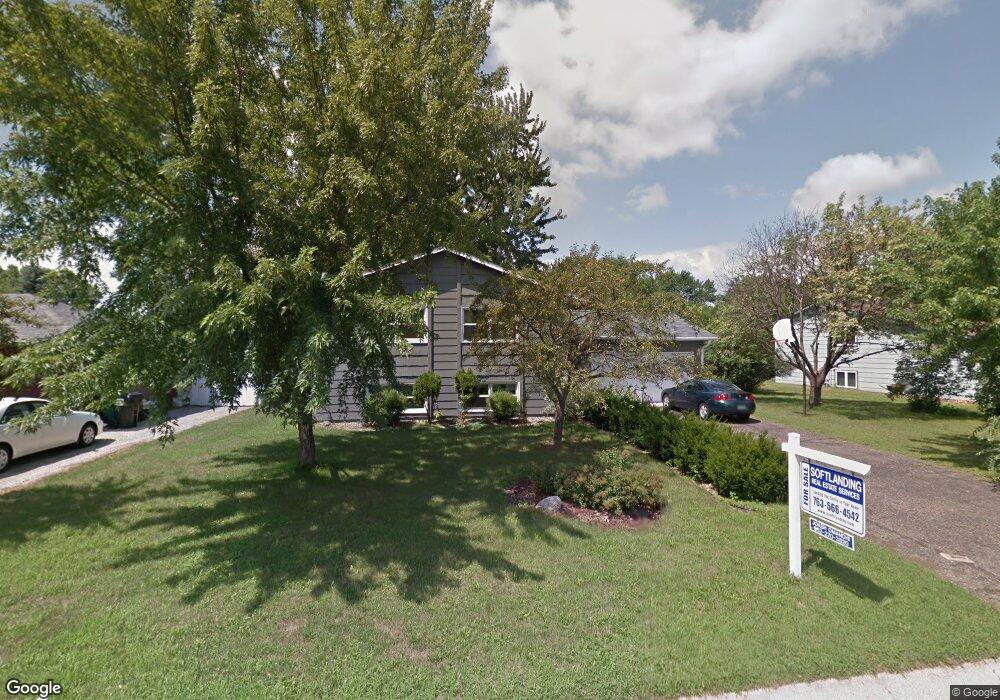
16117 Fishing Ave W Rosemount, MN 55068
Estimated Value: $354,000 - $386,000
4
Beds
2
Baths
1,035
Sq Ft
$358/Sq Ft
Est. Value
About This Home
This home is located at 16117 Fishing Ave W, Rosemount, MN 55068 and is currently estimated at $370,609, approximately $358 per square foot. 16117 Fishing Ave W is a home located in Dakota County with nearby schools including Parkview Elementary School, Scott Highlands Middle School, and Rosemount Senior High School.
Ownership History
Date
Name
Owned For
Owner Type
Purchase Details
Closed on
Jul 9, 2015
Sold by
Mark Elliot Homes Llc
Bought by
Jarski Autumn
Current Estimated Value
Purchase Details
Closed on
Feb 17, 2015
Sold by
Deutsche Bank National Trust Company
Bought by
Mark Elliot Homes Llc
Home Financials for this Owner
Home Financials are based on the most recent Mortgage that was taken out on this home.
Original Mortgage
$162,750
Interest Rate
3.66%
Mortgage Type
Purchase Money Mortgage
Purchase Details
Closed on
Jun 4, 2014
Sold by
Orangi Seth and Orangi Obed
Bought by
Deutsche Bank National Trust Company
Purchase Details
Closed on
May 25, 2006
Sold by
Sterbuck John
Bought by
Okangi Seth and Okangi Obed
Purchase Details
Closed on
Oct 30, 2003
Sold by
Hayes Timothy S and Hayes Lisa M
Bought by
Sterbuck John
Purchase Details
Closed on
Jul 28, 1999
Sold by
Romens Theresa G and Romens Randall
Bought by
Hayes Lisa M and Hayes Timothy S
Create a Home Valuation Report for This Property
The Home Valuation Report is an in-depth analysis detailing your home's value as well as a comparison with similar homes in the area
Home Values in the Area
Average Home Value in this Area
Purchase History
| Date | Buyer | Sale Price | Title Company |
|---|---|---|---|
| Jarski Autumn | $230,000 | Viking Title Llc | |
| Mark Elliot Homes Llc | $150,000 | West Title Llc | |
| Deutsche Bank National Trust Company | $259,766 | None Available | |
| Okangi Seth | $226,000 | -- | |
| Sterbuck John | $199,900 | -- | |
| Hayes Lisa M | $147,600 | -- |
Source: Public Records
Mortgage History
| Date | Status | Borrower | Loan Amount |
|---|---|---|---|
| Previous Owner | Mark Elliot Homes Llc | $162,750 |
Source: Public Records
Tax History Compared to Growth
Tax History
| Year | Tax Paid | Tax Assessment Tax Assessment Total Assessment is a certain percentage of the fair market value that is determined by local assessors to be the total taxable value of land and additions on the property. | Land | Improvement |
|---|---|---|---|---|
| 2024 | $3,576 | $336,200 | $67,400 | $268,800 |
| 2023 | $3,576 | $343,500 | $67,200 | $276,300 |
| 2022 | $2,946 | $328,000 | $67,000 | $261,000 |
| 2021 | $2,710 | $277,800 | $58,300 | $219,500 |
| 2020 | $2,736 | $249,000 | $55,500 | $193,500 |
| 2019 | $2,452 | $244,500 | $51,300 | $193,200 |
| 2018 | $2,261 | $231,500 | $48,800 | $182,700 |
| 2017 | $2,217 | $210,000 | $46,500 | $163,500 |
| 2016 | $2,078 | $198,000 | $44,300 | $153,700 |
| 2015 | $2,625 | $163,647 | $38,181 | $125,466 |
| 2014 | -- | $157,761 | $36,861 | $120,900 |
| 2013 | -- | $142,828 | $33,113 | $109,715 |
Source: Public Records
Map
Nearby Homes
- 6414 158th St W Unit 201
- 6634 162nd Ct Unit 421
- 6744 Foliage Ct W
- 15792 Flan Ct
- 6656 Gerdine Path W
- 15767 Finch Ave
- 6406 157th St W
- 6852 161st St W
- 16563 Fishing Ave W
- 15682 Fjord Ave
- 15681 Flackwood Way
- 15649 Flackwood Way
- 6760 158th St W
- 15675 Flackwood Way
- 6456 157th St W
- 16546 Foliage Ave W
- 6678 166th St W
- 15725 France Way Unit 1416
- 15565 Finch Ave
- 6649 167th St W
- 16099 Fishing Ave W
- 16135 Fishing Ave W
- 16117 16117 Fishing Ave W
- 16118 Flagstaff Ave W
- 16136 Flagstaff Ave W
- 16100 Flagstaff Ave W
- 16081 Fishing Ave W
- 16153 Fishing Ave W
- 16118 Fishing Ave W
- 16136 Fishing Ave W
- 16100 Fishing Ave W
- 16154 Flagstaff Ave W
- 16082 Flagstaff Ave W
- 16154 Fishing Ave W
- 16171 Fishing Ave W
- 16082 Fishing Ave W
- 16063 Fishing Ave W
- 16172 Flagstaff Ave W
- 16064 Flagstaff Ave W
- 16172 16172 Flagstaff Ave W