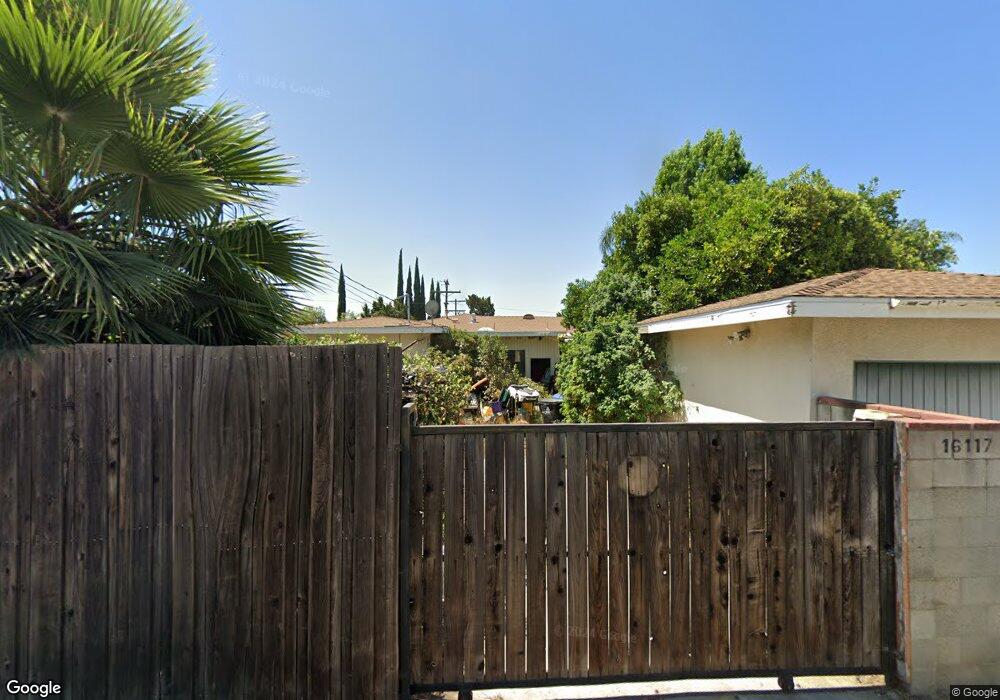
16117 Tuba St North Hills, CA 91343
Estimated Value: $829,638 - $921,000
4
Beds
2
Baths
1,431
Sq Ft
$615/Sq Ft
Est. Value
About This Home
This home is located at 16117 Tuba St, North Hills, CA 91343 and is currently estimated at $880,160, approximately $615 per square foot. 16117 Tuba St is a home located in Los Angeles County with nearby schools including Vintage Math, Science, and Technology Magnet School, Mayall Street Elementary School, and George K. Porter Middle School.
Ownership History
Date
Name
Owned For
Owner Type
Purchase Details
Closed on
Nov 18, 2018
Sold by
Heatherton Michael P and Semarne Veda
Bought by
Heatherton Michael P and Semarne Veda
Current Estimated Value
Purchase Details
Closed on
Jul 25, 2002
Sold by
Heatherton Michael P
Bought by
Heatherton Michael P and Semarne Veda
Home Financials for this Owner
Home Financials are based on the most recent Mortgage that was taken out on this home.
Original Mortgage
$176,500
Interest Rate
6.6%
Purchase Details
Closed on
Mar 24, 2000
Sold by
Portoghesi Charles P
Bought by
Heatherton Michael P and Semarne Veda
Home Financials for this Owner
Home Financials are based on the most recent Mortgage that was taken out on this home.
Original Mortgage
$144,800
Interest Rate
8.3%
Create a Home Valuation Report for This Property
The Home Valuation Report is an in-depth analysis detailing your home's value as well as a comparison with similar homes in the area
Home Values in the Area
Average Home Value in this Area
Purchase History
| Date | Buyer | Sale Price | Title Company |
|---|---|---|---|
| Heatherton Michael P | -- | None Available | |
| Heatherton Michael P | -- | Commerce Title | |
| Heatherton Michael P | $181,000 | American Title Co |
Source: Public Records
Mortgage History
| Date | Status | Borrower | Loan Amount |
|---|---|---|---|
| Closed | Heatherton Michael P | $176,500 | |
| Closed | Heatherton Michael P | $144,800 | |
| Closed | Heatherton Michael P | $27,100 |
Source: Public Records
Tax History Compared to Growth
Tax History
| Year | Tax Paid | Tax Assessment Tax Assessment Total Assessment is a certain percentage of the fair market value that is determined by local assessors to be the total taxable value of land and additions on the property. | Land | Improvement |
|---|---|---|---|---|
| 2025 | $3,479 | $278,169 | $171,978 | $106,191 |
| 2024 | $3,479 | $272,715 | $168,606 | $104,109 |
| 2023 | $3,414 | $267,368 | $165,300 | $102,068 |
| 2022 | $3,258 | $262,126 | $162,059 | $100,067 |
| 2021 | $3,212 | $256,987 | $158,882 | $98,105 |
| 2020 | $3,239 | $254,353 | $157,253 | $97,100 |
| 2019 | $3,117 | $249,367 | $154,170 | $95,197 |
| 2018 | $3,017 | $244,479 | $151,148 | $93,331 |
| 2016 | $2,869 | $234,987 | $145,280 | $89,707 |
| 2015 | $2,827 | $231,458 | $143,098 | $88,360 |
| 2014 | $2,843 | $226,925 | $140,295 | $86,630 |
Source: Public Records
Map
Nearby Homes
- 16038 Devonshire St
- 16053 Devonshire St
- 16130 Devonshire St
- 16001 Tuba St
- 10508 Collett Ave
- 10326 Gothic Ave
- 16301 Stare St
- 9945 Gaviota Ave
- 15758 Lemarsh St
- 10016 Sophia Ave
- 15709 Devonshire St
- 10520 Haskell Ave
- 15657 Devonshire St
- 10345 Blucher Ave
- 15814 Septo St Unit 2
- 15814 Septo St
- 10048 Odessa Ave
- 10713 Woodley Ave
- 16051 Los Alimos St
- 16257 Los Alimos St
- 16121 Tuba St
- 16111 Tuba St
- 16105 Tuba St
- 16127 Tuba St Unit 16129
- 16127 Tuba St
- 16118 Devonshire St
- 16112 Devonshire St
- 10224 Collett Ave
- 16124 Devonshire St
- 16106 Devonshire St
- 10225 Gaviota Ave
- 16055 Tuba St
- 16100 Devonshire St
- 10235 Collett Ave
- 16128 Devonshire St
- 10219 Gaviota Ave
- 10231 Collett Ave
- 16136 Devonshire St
- 16050 Devonshire St
- 10212 Collett Ave