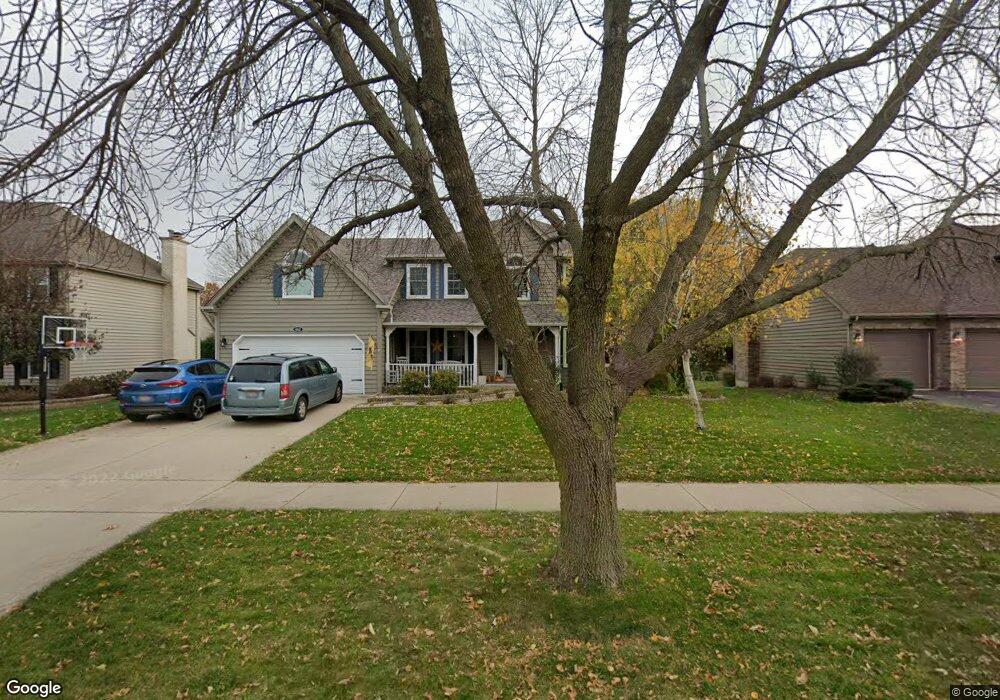
1612 Grommon Rd Naperville, IL 60564
Ashbury NeighborhoodEstimated Value: $747,000 - $783,000
4
Beds
3
Baths
3,203
Sq Ft
$240/Sq Ft
Est. Value
About This Home
This home is located at 1612 Grommon Rd, Naperville, IL 60564 and is currently estimated at $767,727, approximately $239 per square foot. 1612 Grommon Rd is a home located in Will County with nearby schools including Patterson Elementary School, Gordon Gregory Middle School, and Neuqua Valley High School.
Ownership History
Date
Name
Owned For
Owner Type
Purchase Details
Closed on
Dec 18, 2007
Sold by
Holly Michael and Holly Nancy C
Bought by
Young Matthew and Young Karen
Current Estimated Value
Home Financials for this Owner
Home Financials are based on the most recent Mortgage that was taken out on this home.
Original Mortgage
$37,475
Outstanding Balance
$23,732
Interest Rate
6.31%
Mortgage Type
Purchase Money Mortgage
Estimated Equity
$743,995
Purchase Details
Closed on
Aug 28, 2002
Sold by
Parrette Michael D and Parrette Paula M
Bought by
Holly Michael and Holly Nancy C
Home Financials for this Owner
Home Financials are based on the most recent Mortgage that was taken out on this home.
Original Mortgage
$288,000
Interest Rate
4.87%
Mortgage Type
Purchase Money Mortgage
Create a Home Valuation Report for This Property
The Home Valuation Report is an in-depth analysis detailing your home's value as well as a comparison with similar homes in the area
Home Values in the Area
Average Home Value in this Area
Purchase History
| Date | Buyer | Sale Price | Title Company |
|---|---|---|---|
| Young Matthew | $480,000 | Multiple | |
| Holly Michael | $360,000 | -- |
Source: Public Records
Mortgage History
| Date | Status | Borrower | Loan Amount |
|---|---|---|---|
| Open | Young Matthew | $37,475 | |
| Previous Owner | Holly Michael | $288,000 | |
| Closed | Holly Michael | $50,000 |
Source: Public Records
Tax History
| Year | Tax Paid | Tax Assessment Tax Assessment Total Assessment is a certain percentage of the fair market value that is determined by local assessors to be the total taxable value of land and additions on the property. | Land | Improvement |
|---|---|---|---|---|
| 2024 | $12,584 | $200,127 | $65,131 | $134,996 |
| 2023 | $12,584 | $176,790 | $57,536 | $119,254 |
| 2022 | $11,629 | $166,500 | $54,428 | $112,072 |
| 2021 | $11,113 | $158,571 | $51,836 | $106,735 |
| 2020 | $10,902 | $156,059 | $51,015 | $105,044 |
| 2019 | $10,715 | $151,661 | $49,577 | $102,084 |
| 2018 | $10,739 | $149,362 | $48,487 | $100,875 |
| 2017 | $10,575 | $145,506 | $47,235 | $98,271 |
| 2016 | $10,555 | $142,374 | $46,218 | $96,156 |
| 2015 | $10,725 | $136,898 | $44,440 | $92,458 |
| 2014 | $10,725 | $134,242 | $44,440 | $89,802 |
| 2013 | $10,725 | $134,242 | $44,440 | $89,802 |
Source: Public Records
Map
Nearby Homes
- 3720 Mandeville Ln
- 3740 Caine Dr
- 1736 Robert Ln
- 3819 Capri Ct
- 2255 Wendt Cir
- 3804 Relstar Ct
- 3027 Brossman St
- 3111 Landore Dr
- 4507 Barr Creek Ln
- 2344 Corn Lily Rd
- 1123 Thackery Ln
- 4711 Snapjack Cir
- 1126 Starlite Ct
- 820 Spring Creek Cir
- 3847 Gold Cup Ln
- 3520 Timber Creek Ln
- 719 Eagle Brook Ln Unit 4
- 2627 Homestead Dr
- 2828 Bluewater Cir
- 3021 Saganashkee Ln
- 1608 Grommon Rd
- 1616 Grommon Rd
- 1539 Branford Ln
- 1535 Branford Ln
- 1604 Grommon Rd
- 1543 Branford Ln
- 1620 Grommon Rd
- 1611 Grommon Rd
- 1531 Branford Ln
- 1607 Grommon Rd
- 3640 Lawrence Dr Unit 4
- 3708 Lawrence Dr Unit 4
- 1536 Grommon Rd
- 1547 Branford Ln
- 1527 Branford Ln
- 3712 Lawrence Dr
- 1544 Branford Ln
- 3636 Lawrence Dr Unit 4
- 3627 Othello Dr
- 1535 Grommon Rd
Your Personal Tour Guide
Ask me questions while you tour the home.