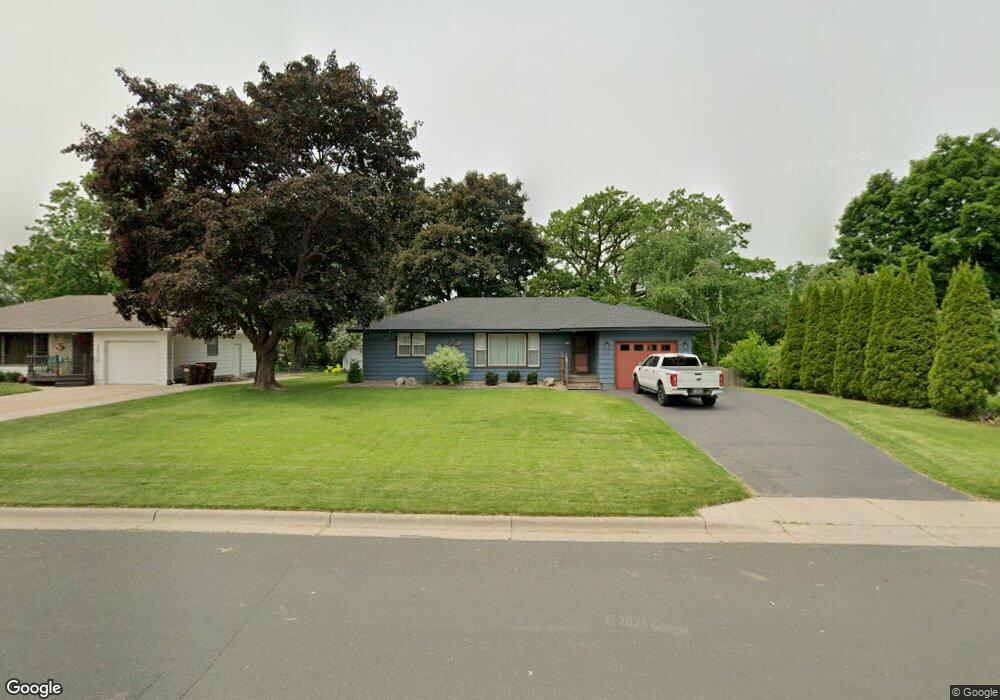
1612 Maple St Hastings, MN 55033
Hastings-Marshan Township NeighborhoodEstimated Value: $326,111 - $338,000
3
Beds
2
Baths
1,248
Sq Ft
$265/Sq Ft
Est. Value
About This Home
This home is located at 1612 Maple St, Hastings, MN 55033 and is currently estimated at $331,278, approximately $265 per square foot. 1612 Maple St is a home located in Dakota County with nearby schools including Pinecrest Elementary School, Hastings Middle School, and Hastings High School.
Ownership History
Date
Name
Owned For
Owner Type
Purchase Details
Closed on
Nov 24, 2015
Sold by
Schweich Charlie and Schweich Sarah L
Bought by
Schweich Charles N and Schweich Sarah L
Current Estimated Value
Home Financials for this Owner
Home Financials are based on the most recent Mortgage that was taken out on this home.
Original Mortgage
$180,000
Outstanding Balance
$108,331
Interest Rate
3.8%
Mortgage Type
New Conventional
Estimated Equity
$222,947
Purchase Details
Closed on
Sep 29, 2005
Sold by
Berg Rebecca A and Berg Rebecca A
Bought by
Bill Sarah L
Purchase Details
Closed on
Jul 30, 1999
Sold by
Rico Jason John William and Rico Cynthia Dianne
Bought by
Willett Rebecca A
Create a Home Valuation Report for This Property
The Home Valuation Report is an in-depth analysis detailing your home's value as well as a comparison with similar homes in the area
Home Values in the Area
Average Home Value in this Area
Purchase History
| Date | Buyer | Sale Price | Title Company |
|---|---|---|---|
| Schweich Charles N | -- | Dca Title | |
| Bill Sarah L | $215,000 | -- | |
| Willett Rebecca A | $117,000 | -- |
Source: Public Records
Mortgage History
| Date | Status | Borrower | Loan Amount |
|---|---|---|---|
| Open | Schweich Charles N | $180,000 |
Source: Public Records
Tax History Compared to Growth
Tax History
| Year | Tax Paid | Tax Assessment Tax Assessment Total Assessment is a certain percentage of the fair market value that is determined by local assessors to be the total taxable value of land and additions on the property. | Land | Improvement |
|---|---|---|---|---|
| 2024 | $3,330 | $289,900 | $65,700 | $224,200 |
| 2023 | $3,330 | $296,900 | $65,800 | $231,100 |
| 2022 | $3,228 | $282,300 | $65,700 | $216,600 |
| 2021 | $3,194 | $231,500 | $57,100 | $174,400 |
| 2020 | $3,282 | $226,200 | $54,400 | $171,800 |
| 2019 | $3,176 | $224,700 | $54,200 | $170,500 |
| 2018 | $3,017 | $206,200 | $51,600 | $154,600 |
| 2017 | $2,891 | $188,500 | $49,100 | $139,400 |
| 2016 | $2,908 | $178,700 | $45,900 | $132,800 |
| 2015 | $2,744 | $153,292 | $39,112 | $114,180 |
| 2014 | -- | $141,629 | $37,025 | $104,604 |
| 2013 | -- | $122,336 | $32,422 | $89,914 |
Source: Public Records
Map
Nearby Homes