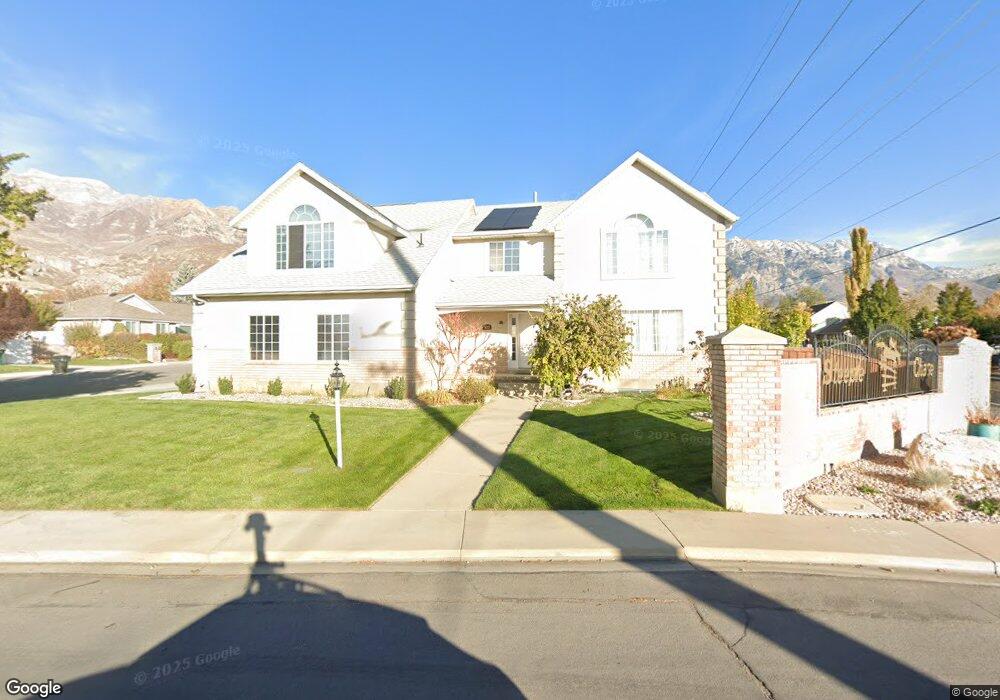
1612 N 210 E Orem, UT 84057
Northridge NeighborhoodEstimated Value: $773,318 - $846,000
4
Beds
3
Baths
4,104
Sq Ft
$195/Sq Ft
Est. Value
About This Home
This home is located at 1612 N 210 E, Orem, UT 84057 and is currently estimated at $801,439, approximately $195 per square foot. 1612 N 210 E is a home located in Utah County with nearby schools including Northridge Elementary School, Oak Canyon Junior High School, and Timpanogos High School.
Ownership History
Date
Name
Owned For
Owner Type
Purchase Details
Closed on
May 5, 2023
Sold by
Crandall Vernon L
Bought by
Crandall Vernon Lee
Current Estimated Value
Home Financials for this Owner
Home Financials are based on the most recent Mortgage that was taken out on this home.
Original Mortgage
$549,450
Outstanding Balance
$533,976
Interest Rate
6.32%
Mortgage Type
FHA
Estimated Equity
$267,463
Purchase Details
Closed on
May 10, 1996
Sold by
Chian Me Hong and Chian Shu Fang Peggy
Bought by
Crandall Vernon L and Crandall Joann K
Home Financials for this Owner
Home Financials are based on the most recent Mortgage that was taken out on this home.
Original Mortgage
$198,000
Interest Rate
7.68%
Create a Home Valuation Report for This Property
The Home Valuation Report is an in-depth analysis detailing your home's value as well as a comparison with similar homes in the area
Home Values in the Area
Average Home Value in this Area
Purchase History
| Date | Buyer | Sale Price | Title Company |
|---|---|---|---|
| Crandall Vernon Lee | -- | Real Advantage Title | |
| Crandall Vernon L | -- | -- |
Source: Public Records
Mortgage History
| Date | Status | Borrower | Loan Amount |
|---|---|---|---|
| Open | Crandall Vernon Lee | $549,450 | |
| Previous Owner | Crandall Vernon L | $198,000 |
Source: Public Records
Tax History
| Year | Tax Paid | Tax Assessment Tax Assessment Total Assessment is a certain percentage of the fair market value that is determined by local assessors to be the total taxable value of land and additions on the property. | Land | Improvement |
|---|---|---|---|---|
| 2025 | $2,856 | $381,150 | -- | -- |
| 2024 | $2,856 | $349,250 | $0 | $0 |
| 2023 | $2,709 | $356,015 | $0 | $0 |
| 2022 | $2,925 | $372,405 | $0 | $0 |
| 2021 | $2,652 | $511,400 | $187,200 | $324,200 |
| 2020 | $2,488 | $471,600 | $162,800 | $308,800 |
| 2019 | $2,188 | $431,300 | $162,800 | $268,500 |
| 2018 | $2,215 | $417,200 | $162,800 | $254,400 |
| 2017 | $1,811 | $182,710 | $0 | $0 |
| 2016 | $1,760 | $163,680 | $0 | $0 |
| 2015 | $1,665 | $163,570 | $0 | $0 |
| 2014 | $1,795 | $157,190 | $0 | $0 |
Source: Public Records
Map
Nearby Homes
- 1636 N 160 E
- 1638 N 160 E
- 363 E 1395 N Unit 22
- 1480 N 430 E
- 1371 N 330 E Unit 8
- 540 E Quail Rd
- 49 W 1880 N
- 723 E 1450 N Unit 25
- 1744 N 280 W
- 1566 N 275 West St Unit 1
- 1548 N 275 West St Unit 2
- 1547 N 275 West St Unit 5
- 372 E 1165 N
- 287 W 1380 N
- 695 E 1870 N
- 332 W Amiron Way Unit D
- 110 S 1320 E
- 1643 N Mountain Oaks Dr
- 713 E 1450 N Unit 23
- 1461 N Amiron Way Unit B
Your Personal Tour Guide
Ask me questions while you tour the home.