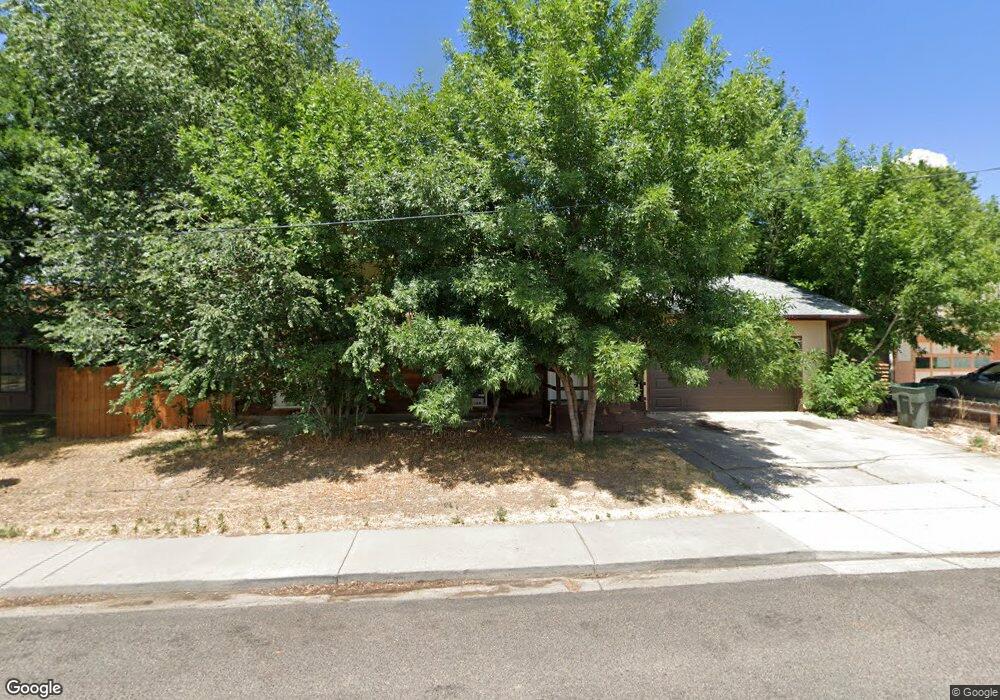
1612 Walnut Ave Grand Junction, CO 81501
Downtown Grand Junction NeighborhoodEstimated Value: $342,000 - $410,000
3
Beds
2
Baths
1,686
Sq Ft
$219/Sq Ft
Est. Value
About This Home
This home is located at 1612 Walnut Ave, Grand Junction, CO 81501 and is currently estimated at $369,914, approximately $219 per square foot. 1612 Walnut Ave is a home located in Mesa County with nearby schools including Orchard Avenue Elementary School, West Middle School, and East Middle School.
Ownership History
Date
Name
Owned For
Owner Type
Purchase Details
Closed on
Oct 6, 2020
Sold by
Rogers Kathy A and Rogers Bryan K
Bought by
Bryan And Kathy Rogers Frt
Current Estimated Value
Home Financials for this Owner
Home Financials are based on the most recent Mortgage that was taken out on this home.
Original Mortgage
$136,000
Outstanding Balance
$109,477
Interest Rate
2.9%
Mortgage Type
New Conventional
Estimated Equity
$260,437
Purchase Details
Closed on
Jan 23, 2008
Sold by
Rogers Kathy A and Rogers Bryan K
Bought by
Rogers Kathy A and Rogers Bryan K
Purchase Details
Closed on
Feb 24, 2006
Sold by
Hokanson Ed and Baldwin Samuel J
Bought by
Rogers Kathy A and Rogers Bryan K
Purchase Details
Closed on
Apr 8, 1994
Sold by
Price Charles N
Bought by
Rogers Kathy A Trustee
Purchase Details
Closed on
Mar 31, 1989
Sold by
Guadnola James A
Bought by
Rogers Kathy A Trustee
Create a Home Valuation Report for This Property
The Home Valuation Report is an in-depth analysis detailing your home's value as well as a comparison with similar homes in the area
Home Values in the Area
Average Home Value in this Area
Purchase History
| Date | Buyer | Sale Price | Title Company |
|---|---|---|---|
| Bryan And Kathy Rogers Frt | -- | Land Title Guarantee | |
| Rogers Kathy A | -- | None Available | |
| Kathy And Bryan Rogers Revocable Trust | -- | Land Title Guarantee Company | |
| Rogers Kathy A | -- | None Available | |
| Rogers Kathy A | $148,000 | Meridian Land Title Llc | |
| Rogers Kathy A Trustee | $88,000 | -- | |
| Rogers Kathy A Trustee | $63,300 | -- |
Source: Public Records
Mortgage History
| Date | Status | Borrower | Loan Amount |
|---|---|---|---|
| Open | Rogers Kathy A | $136,000 |
Source: Public Records
Tax History Compared to Growth
Tax History
| Year | Tax Paid | Tax Assessment Tax Assessment Total Assessment is a certain percentage of the fair market value that is determined by local assessors to be the total taxable value of land and additions on the property. | Land | Improvement |
|---|---|---|---|---|
| 2024 | $1,314 | $18,580 | $4,750 | $13,830 |
| 2023 | $1,314 | $18,580 | $4,750 | $13,830 |
| 2022 | $1,210 | $16,790 | $3,480 | $13,310 |
| 2021 | $1,215 | $17,280 | $3,580 | $13,700 |
| 2020 | $992 | $14,440 | $3,580 | $10,860 |
| 2019 | $938 | $14,440 | $3,580 | $10,860 |
| 2018 | $913 | $12,900 | $3,240 | $9,660 |
| 2017 | $909 | $12,900 | $3,240 | $9,660 |
| 2016 | $824 | $13,130 | $3,380 | $9,750 |
| 2015 | $834 | $13,130 | $3,380 | $9,750 |
| 2014 | $788 | $12,490 | $2,790 | $9,700 |
Source: Public Records
Map
Nearby Homes
- 1545 Orchard Ave
- 1890 & 1895 Wellington Ave
- 1749 N 15th St
- 1731 N 16th St
- 1725 N 18th St
- 1290 Walnut Ave
- 1270 Walnut Ave Unit A, B, C, D
- 1212 Walnut Ave Unit 38 / Door 7
- 1214 Walnut Ave Unit 28 / 12 on door
- 2202 Orchard Ave
- 1615 N 20th St
- 2738 Patterson Rd
- 2644 Patterson Rd
- 2115 N 24th St
- 1775,1765,1755 Wellington Ave
- 1875 & 1885 Wellington Ave
- 1628 Lowell Ln
- 1140 Walnut Ave Unit 37
- 1405 Elm Ave
- 2150 College Place Unit 13
- 1622 Walnut Ave
- 2141 N 17th Cir
- 1603 Walnut Ave
- 1603 Walnut Ave
- 1603 Walnut Ave
- 2145 N 17th Cir
- 1555 Walnut Ave
- 1632 Walnut Ave
- 2131 N 17th Cir
- 1625 Walnut Ave
- 1545 Walnut Ave
- 1525 Cedar Ct
- 1642 Walnut Ave
- N 17th Cir
- 2151 N 17th Cir
- 1535 Walnut Ave
- 2122 N 17th Cir
- 2121 N 17th Cir
- 1645 Walnut Ave
- 1562 Pinyon Ave