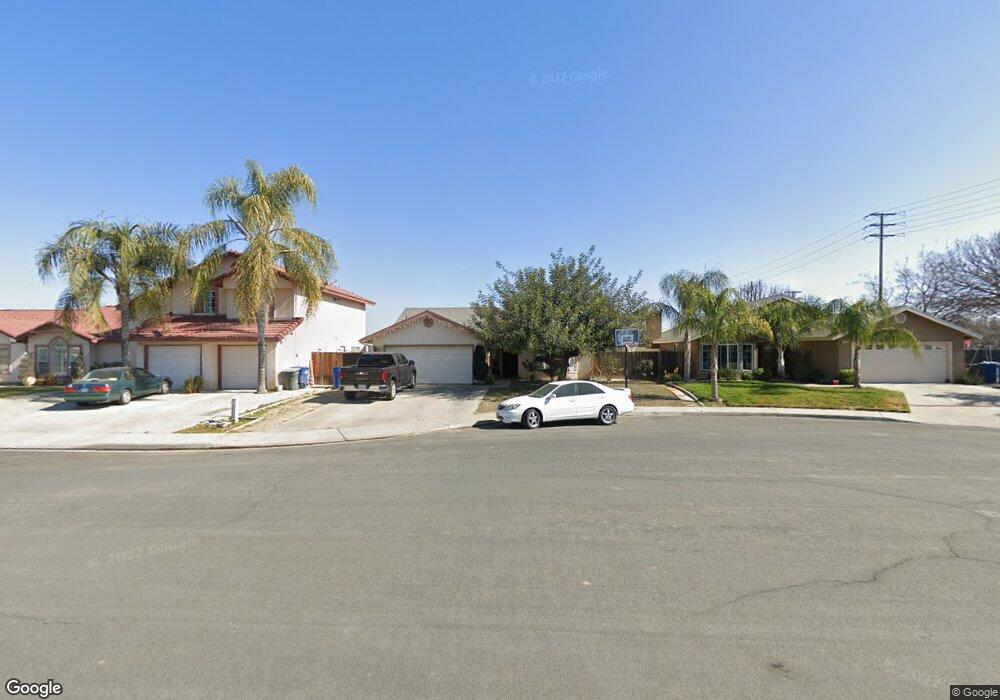
1612 York St Delano, CA 93215
East Delano NeighborhoodEstimated Value: $322,000 - $398,000
3
Beds
3
Baths
1,345
Sq Ft
$263/Sq Ft
Est. Value
About This Home
This home is located at 1612 York St, Delano, CA 93215 and is currently estimated at $353,909, approximately $263 per square foot. 1612 York St is a home located in Kern County with nearby schools including Harvest Elementary School, La Vina Middle School, and Delano High School.
Ownership History
Date
Name
Owned For
Owner Type
Purchase Details
Closed on
Apr 25, 1994
Sold by
Workman Bros Development Co Inc
Bought by
Pingquian Eduardo A and Pingquian Nerlita T
Current Estimated Value
Home Financials for this Owner
Home Financials are based on the most recent Mortgage that was taken out on this home.
Original Mortgage
$85,225
Interest Rate
8.57%
Mortgage Type
FHA
Create a Home Valuation Report for This Property
The Home Valuation Report is an in-depth analysis detailing your home's value as well as a comparison with similar homes in the area
Home Values in the Area
Average Home Value in this Area
Purchase History
| Date | Buyer | Sale Price | Title Company |
|---|---|---|---|
| Pingquian Eduardo A | $86,000 | Commonwealth Land Title Co |
Source: Public Records
Mortgage History
| Date | Status | Borrower | Loan Amount |
|---|---|---|---|
| Previous Owner | Pingquian Eduardo A | $85,225 |
Source: Public Records
Tax History Compared to Growth
Tax History
| Year | Tax Paid | Tax Assessment Tax Assessment Total Assessment is a certain percentage of the fair market value that is determined by local assessors to be the total taxable value of land and additions on the property. | Land | Improvement |
|---|---|---|---|---|
| 2025 | $1,869 | $144,337 | $33,576 | $110,761 |
| 2024 | $1,819 | $141,508 | $32,918 | $108,590 |
| 2023 | $1,819 | $138,734 | $32,273 | $106,461 |
| 2022 | $1,790 | $136,015 | $31,641 | $104,374 |
| 2021 | $1,720 | $133,349 | $31,021 | $102,328 |
| 2020 | $1,717 | $131,982 | $30,703 | $101,279 |
| 2019 | $1,689 | $131,982 | $30,703 | $101,279 |
| 2018 | $1,669 | $126,859 | $29,511 | $97,348 |
| 2017 | $1,679 | $124,373 | $28,933 | $95,440 |
| 2016 | $1,654 | $121,935 | $28,366 | $93,569 |
| 2015 | $1,706 | $120,104 | $27,940 | $92,164 |
| 2014 | $1,600 | $117,752 | $27,393 | $90,359 |
Source: Public Records
Map
Nearby Homes