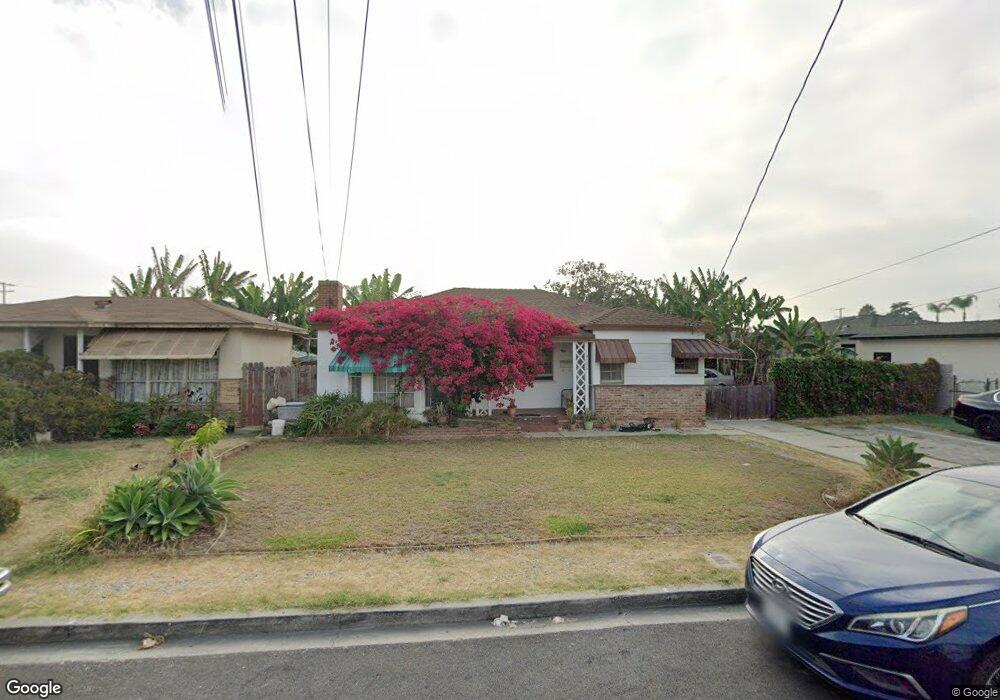
16126 S Menlo Ave Gardena, CA 90247
Harbor Gateway NeighborhoodEstimated Value: $723,000 - $849,000
2
Beds
1
Bath
1,099
Sq Ft
$693/Sq Ft
Est. Value
About This Home
This home is located at 16126 S Menlo Ave, Gardena, CA 90247 and is currently estimated at $761,879, approximately $693 per square foot. 16126 S Menlo Ave is a home located in Los Angeles County with nearby schools including Gardena Elementary School, Robert E. Peary Middle School, and Gardena Senior High School.
Ownership History
Date
Name
Owned For
Owner Type
Purchase Details
Closed on
Apr 20, 2018
Sold by
Fahimian Siroos
Bought by
Fahmian Sohail and Arash Irrevocable
Current Estimated Value
Purchase Details
Closed on
Apr 18, 2013
Sold by
Fahimian Soraya and Bypass/Exemption Trust Of Fahi
Bought by
Fahimian Siroos and Soraya Fahimian Irrevocable Trust
Purchase Details
Closed on
Mar 28, 2012
Sold by
Fahimian Soraya and Fahimian Family Trust
Bought by
Fahimian Soraya and Fahimian Family Trust
Purchase Details
Closed on
Oct 13, 2011
Sold by
Fahimian Soraya and Fahimian Family Trust
Bought by
Fahimian Soraya and Fahimian Family Trust
Purchase Details
Closed on
Jan 21, 2009
Sold by
Fahmian Sohail
Bought by
Fahimian Family Trust
Purchase Details
Closed on
Mar 25, 2004
Sold by
Fahmian Sohail
Bought by
Fahmian Sohail
Purchase Details
Closed on
Feb 27, 2003
Sold by
Nguyen Trien Cao
Bought by
Fahmian Sohail
Purchase Details
Closed on
Mar 16, 1992
Sold by
Nguyen Trien Cao and Nguyen My Linh
Bought by
Fahmian Sohail
Create a Home Valuation Report for This Property
The Home Valuation Report is an in-depth analysis detailing your home's value as well as a comparison with similar homes in the area
Home Values in the Area
Average Home Value in this Area
Purchase History
| Date | Buyer | Sale Price | Title Company |
|---|---|---|---|
| Fahmian Sohail | $920,454 | None Available | |
| Fahimian Siroos | -- | None Available | |
| Fahimian Soraya | -- | None Available | |
| Fahimian Soraya | -- | None Available | |
| Fahimian Family Trust | $180,000 | None Available | |
| Fahmian Sohail | -- | -- | |
| Fahmian Sohail | $13,500 | -- | |
| Fahmian Sohail | $30,000 | -- |
Source: Public Records
Tax History Compared to Growth
Tax History
| Year | Tax Paid | Tax Assessment Tax Assessment Total Assessment is a certain percentage of the fair market value that is determined by local assessors to be the total taxable value of land and additions on the property. | Land | Improvement |
|---|---|---|---|---|
| 2025 | $5,839 | $451,712 | $398,238 | $53,474 |
| 2024 | $5,839 | $442,856 | $390,430 | $52,426 |
| 2023 | $5,730 | $434,174 | $382,775 | $51,399 |
| 2022 | $5,474 | $425,662 | $375,270 | $50,392 |
| 2021 | $5,405 | $417,316 | $367,912 | $49,404 |
| 2019 | $5,249 | $518,160 | $428,400 | $89,760 |
| 2018 | $4,747 | $362,553 | $254,328 | $108,225 |
| 2016 | $4,536 | $348,476 | $244,453 | $104,023 |
| 2015 | $4,469 | $343,243 | $240,782 | $102,461 |
| 2014 | $4,486 | $336,520 | $236,066 | $100,454 |
Source: Public Records
Map
Nearby Homes
- 736 W 158th St
- 15813 Bonsallo Ave
- 16122 S Denver Ave
- 850 W 157th St Unit 6
- 16101 S Figueroa St
- 16619 S Denver Ave
- 16701 S Denver Ave
- 1144 Magnolia Ave
- 1308 W 163rd St Unit 1
- 15505 S Budlong Place
- 17002 S Catalina Ave
- 710 W 172nd St
- 16911 S Raymond Place
- 764 W 173rd Place
- 15205 S Budlong Ave Unit 1
- 15205 S Budlong Ave Unit 7
- 15205 S Budlong Ave Unit 9
- 15214 S Raymond Ave Unit 105
- 15804 S Dalton Ave
- 15116 S Raymond Ave Unit 104
- 16120 S Menlo Ave
- 16190 S Menlo Ave
- 16125 S Orchard Ave
- 16208 S Menlo Ave
- 16129 S Orchard Ave
- 16121 S Orchard Ave
- 16203 S Orchard Ave
- 750 W Alondra Blvd
- 16207 S Orchard Ave
- 16129 S Menlo Ave
- 16123 S Menlo Ave
- 746 W Alondra Blvd
- 16212 S Menlo Ave
- 16203 S Menlo Ave
- 16117 S Menlo Ave
- 16205 S Menlo Ave
- 16113 S Menlo Ave
- 16215 S Orchard Ave
- 730 W Alondra Blvd
- 16213 S Menlo Ave