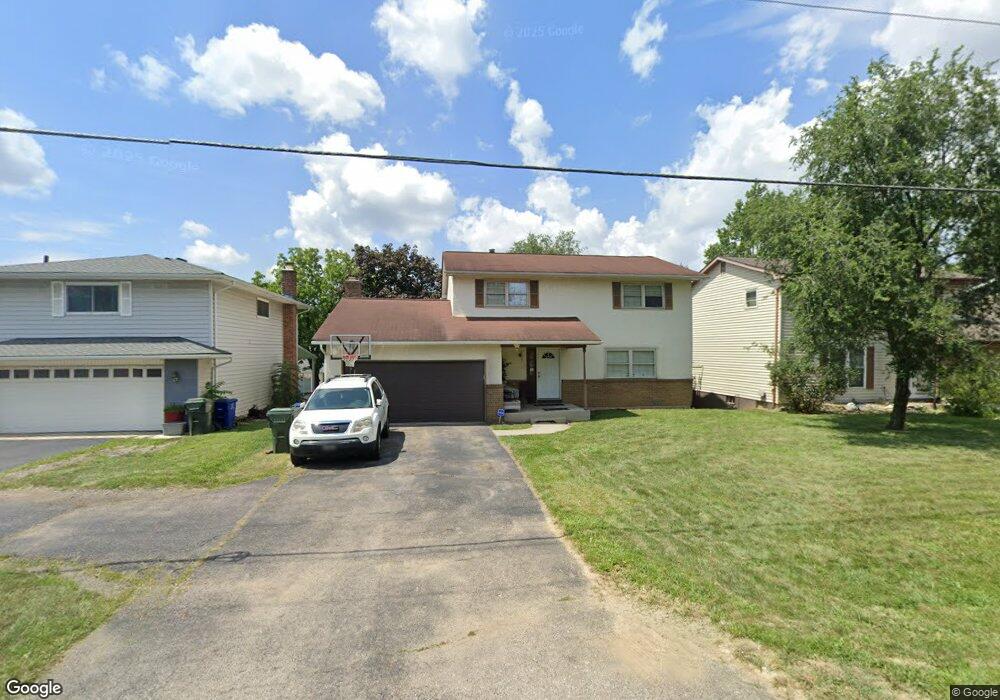
1613 Demorest Rd Columbus, OH 43228
Riverbend NeighborhoodEstimated Value: $246,000 - $284,000
4
Beds
3
Baths
1,866
Sq Ft
$145/Sq Ft
Est. Value
About This Home
This home is located at 1613 Demorest Rd, Columbus, OH 43228 and is currently estimated at $270,730, approximately $145 per square foot. 1613 Demorest Rd is a home located in Franklin County with nearby schools including West Franklin Elementary School, Franklin Woods Intermediate School, and Finland Middle School.
Ownership History
Date
Name
Owned For
Owner Type
Purchase Details
Closed on
Jul 31, 2013
Sold by
Moore Clinton and Selvey Detra
Bought by
Curtis Kenneth J
Current Estimated Value
Purchase Details
Closed on
Apr 24, 2009
Sold by
Wells Fargo Bank Na
Bought by
Moore Clinton and Selvey Detra
Purchase Details
Closed on
Jan 29, 2009
Sold by
Evans Steven R and Case #08Cve01 643
Bought by
Wells Fargo Bank Na
Purchase Details
Closed on
Mar 23, 2005
Sold by
Patronsky Stephen J and Patronsky Sandra M
Bought by
Evans Steven R and Evans Stephanie L
Purchase Details
Closed on
Jun 10, 1986
Bought by
Patronsky Stephen J
Create a Home Valuation Report for This Property
The Home Valuation Report is an in-depth analysis detailing your home's value as well as a comparison with similar homes in the area
Home Values in the Area
Average Home Value in this Area
Purchase History
| Date | Buyer | Sale Price | Title Company |
|---|---|---|---|
| Curtis Kenneth J | $18,000 | None Available | |
| Moore Clinton | $82,500 | None Available | |
| Wells Fargo Bank Na | $100,000 | None Available | |
| Evans Steven R | $137,200 | Chicago Tit | |
| Patronsky Stephen J | $73,500 | -- |
Source: Public Records
Tax History
| Year | Tax Paid | Tax Assessment Tax Assessment Total Assessment is a certain percentage of the fair market value that is determined by local assessors to be the total taxable value of land and additions on the property. | Land | Improvement |
|---|---|---|---|---|
| 2025 | $3,191 | $85,330 | $22,050 | $63,280 |
| 2024 | $3,191 | $85,330 | $22,050 | $63,280 |
| 2023 | $3,136 | $85,330 | $22,050 | $63,280 |
| 2022 | $2,661 | $53,130 | $10,080 | $43,050 |
| 2021 | $2,714 | $53,130 | $10,080 | $43,050 |
| 2020 | $2,700 | $53,130 | $10,080 | $43,050 |
| 2019 | $2,452 | $42,560 | $8,400 | $34,160 |
| 2018 | $2,382 | $42,560 | $8,400 | $34,160 |
| 2017 | $2,378 | $42,560 | $8,400 | $34,160 |
| 2016 | $2,322 | $37,320 | $6,550 | $30,770 |
| 2015 | $2,322 | $37,320 | $6,550 | $30,770 |
| 2014 | $2,325 | $37,320 | $6,550 | $30,770 |
| 2013 | $1,246 | $41,475 | $7,280 | $34,195 |
Source: Public Records
Map
Nearby Homes
- 3836 Alkire Rd
- 1490 Demorest Rd
- 1830 Winding Hollow Dr
- 1995 Jacinth Ct
- 3586 Alkire Rd
- 1936 Bay Port Dr
- 1175-1177 Mccarley Dr S
- 4655 Parkwick Dr
- 1722 Hollow Run Dr
- 3664-3670 Mccarley Dr S
- 2147 Exemplar Ct
- 1842 Bashan Dr Unit 75F
- 4531 White Leaf Way
- 1657 Ripplebrook Rd
- 4289 Demorest Highlands Ln
- 4459 Amwood St
- 3407 Western Hill Rd
- 4633 Parrau Dr Unit 70F
- 1605 Greenville Rd
- 4641 Athalia Dr Unit 18B
- 1619 Demorest Rd
- 1609 Demorest Rd
- 1594 Delgany St
- 1623 Demorest Rd
- 1603 Demorest Rd
- 1602 Delgany St
- 1588 Delgany St
- 1610 Delgany St
- 1661 Green Friar Dr
- 1599 Demorest Rd
- 4002 Donegal Ct
- 1655 Green Friar Dr
- 1582 Delgany St
- 1667 Green Friar Dr
- 1647 Green Friar Dr
- 1616 Delgany St
- 3802 Dunlane Ct
- 1641 Green Friar Dr
- 1591 Demorest Rd
- 1673 Green Friar Dr
Your Personal Tour Guide
Ask me questions while you tour the home.