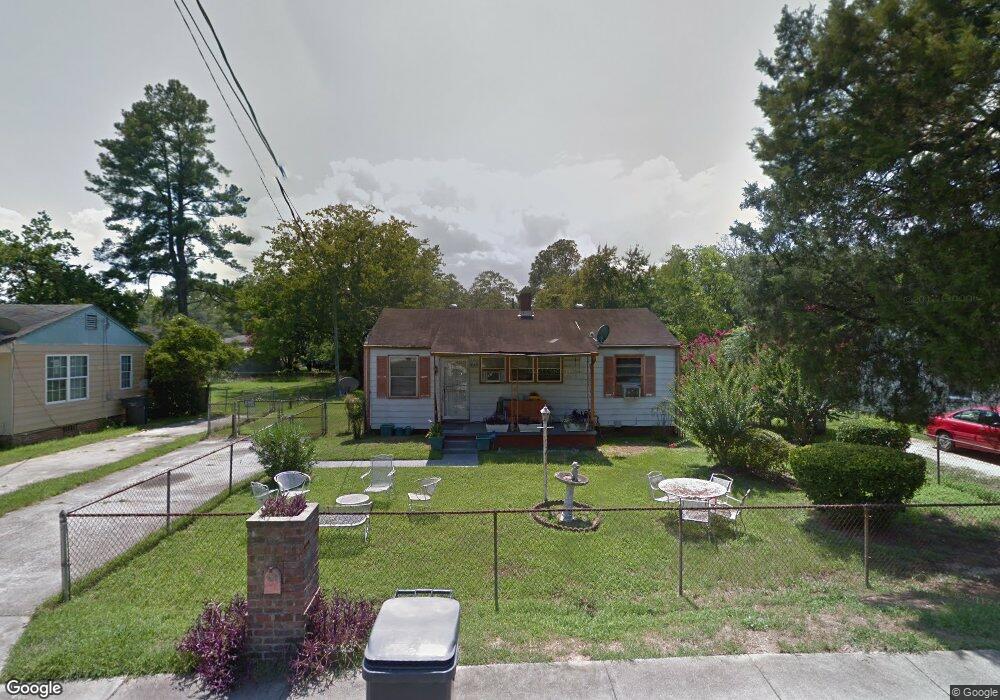
1613 Princeton Ln Augusta, GA 30904
Albion Acres NeighborhoodEstimated Value: $66,000 - $106,000
2
Beds
1
Bath
900
Sq Ft
$93/Sq Ft
Est. Value
About This Home
This home is located at 1613 Princeton Ln, Augusta, GA 30904 and is currently estimated at $83,742, approximately $93 per square foot. 1613 Princeton Ln is a home located in Richmond County with nearby schools including Wilkinson Gardens Elementary School, Murphey Middle School, and Johnson Magnet.
Ownership History
Date
Name
Owned For
Owner Type
Purchase Details
Closed on
Jul 1, 2019
Sold by
Maioriello L E
Bought by
Johnson Donald and Johnson Demetrice E
Current Estimated Value
Home Financials for this Owner
Home Financials are based on the most recent Mortgage that was taken out on this home.
Original Mortgage
$10,500
Interest Rate
3.9%
Mortgage Type
New Conventional
Purchase Details
Closed on
Apr 15, 2016
Sold by
Blackmon Demetrice E
Bought by
Maioriello L E
Purchase Details
Closed on
Jun 13, 2002
Sold by
Maioriello L E
Bought by
Blackmon Demetrice C
Home Financials for this Owner
Home Financials are based on the most recent Mortgage that was taken out on this home.
Original Mortgage
$20,200
Interest Rate
10%
Mortgage Type
Seller Take Back
Purchase Details
Closed on
Nov 7, 2000
Sold by
Bennett Nathaniel J
Bought by
First Union National Bank
Create a Home Valuation Report for This Property
The Home Valuation Report is an in-depth analysis detailing your home's value as well as a comparison with similar homes in the area
Home Values in the Area
Average Home Value in this Area
Purchase History
| Date | Buyer | Sale Price | Title Company |
|---|---|---|---|
| Johnson Donald | $10,500 | -- | |
| Maioriello L E | -- | -- | |
| Blackmon Demetrice C | $20,200 | -- | |
| First Union National Bank | $13,000 | -- |
Source: Public Records
Mortgage History
| Date | Status | Borrower | Loan Amount |
|---|---|---|---|
| Closed | Johnson Donald | $10,500 | |
| Previous Owner | Blackmon Demetrice C | $20,200 |
Source: Public Records
Tax History Compared to Growth
Tax History
| Year | Tax Paid | Tax Assessment Tax Assessment Total Assessment is a certain percentage of the fair market value that is determined by local assessors to be the total taxable value of land and additions on the property. | Land | Improvement |
|---|---|---|---|---|
| 2025 | $1,158 | $25,624 | $1,809 | $23,815 |
| 2024 | $1,158 | $28,516 | $1,809 | $26,707 |
| 2023 | $886 | $19,104 | $1,809 | $17,295 |
| 2022 | $773 | $13,471 | $1,809 | $11,662 |
| 2021 | $610 | $6,986 | $1,802 | $5,184 |
| 2020 | $522 | $10,621 | $1,802 | $8,819 |
| 2019 | $739 | $10,621 | $1,802 | $8,819 |
| 2018 | $742 | $10,621 | $1,802 | $8,819 |
| 2017 | $686 | $10,621 | $1,802 | $8,819 |
| 2016 | $524 | $10,621 | $1,802 | $8,819 |
| 2015 | $526 | $10,621 | $1,802 | $8,819 |
| 2014 | $498 | $9,759 | $1,802 | $7,956 |
Source: Public Records
Map
Nearby Homes
- 2021 Wharton Dr
- 2028 Wharton Dr
- 2038 Wharton Dr
- 2048 Wharton Dr
- 1720 Cornell Dr
- 1729 Oak Dr
- 1548 Koger St
- 1703 Holly Hill Rd
- 2004 Roosevelt Dr
- 2001 Hiram Rd
- 2135 Shirley Ave
- 1533 Wooten Rd
- 1736 Kissingbower Rd
- 1747 King Woods Dr
- 1613 Kissingbower Rd
- 1755 King Woods Dr
- 1750 Kissingbower Rd
- 1717 Morgan St
- 1741 Kissingbower Rd
- 1615 Princeton Ln
- 1611 Princeton Ln
- 1614 Cornell Dr
- 1609 Princeton Ln
- 1612 Cornell Dr
- 1616 Cornell Dr
- 2012 Wharton Dr
- 1610 Cornell Dr
- 2014 Wharton Dr
- 1614 Princeton Ln
- 1616 Princeton Ln
- 1607 Princeton Ln
- 1612 Princeton Ln
- 1618 Princeton Ln
- 1618 Cornell Dr
- 1608 Cornell Dr
- 1610 Princeton Ln
- 1608 Cornell Dr
- 1620 Princeton Ln
- 1605 Princeton Ln