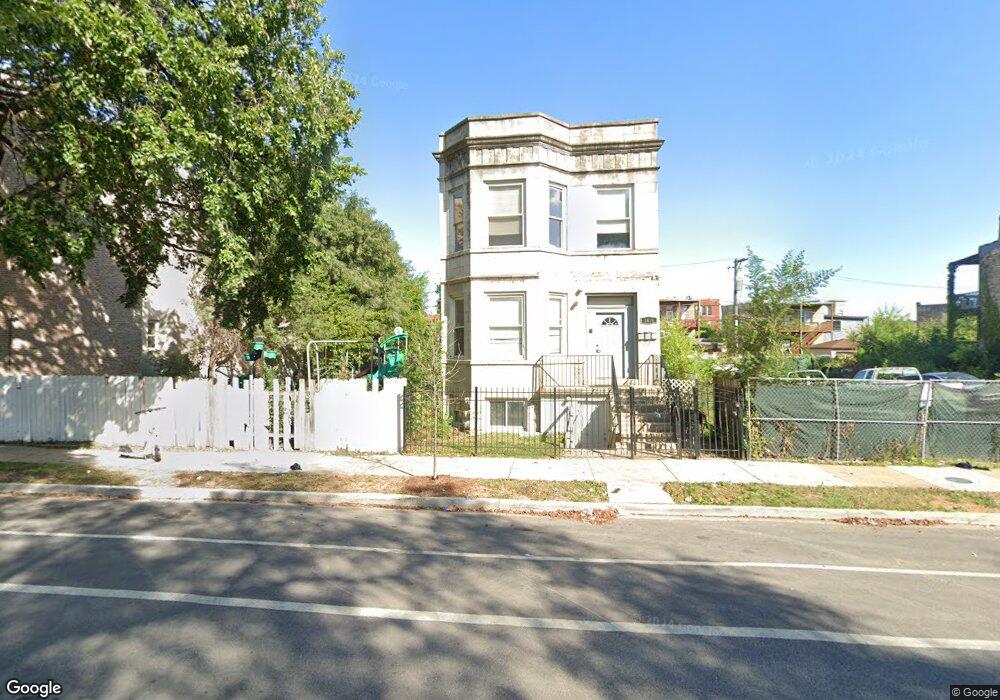
1613 S Homan Ave Chicago, IL 60623
North Lawndale NeighborhoodEstimated Value: $23,000
--
Bed
--
Bath
2,102
Sq Ft
$11/Sq Ft
Est. Value
About This Home
This home is located at 1613 S Homan Ave, Chicago, IL 60623 and is currently estimated at $23,000, approximately $10 per square foot. 1613 S Homan Ave is a home located in Cook County with nearby schools including Johnson Elementary School and Chicago Jesuit Academy.
Ownership History
Date
Name
Owned For
Owner Type
Purchase Details
Closed on
Dec 2, 2020
Sold by
Lu Wun Hsiung
Bought by
Clemons Justin
Current Estimated Value
Home Financials for this Owner
Home Financials are based on the most recent Mortgage that was taken out on this home.
Original Mortgage
$2,171
Interest Rate
2.7%
Mortgage Type
Seller Take Back
Purchase Details
Closed on
Apr 12, 2003
Sold by
Casas Lisa
Bought by
Lu Wen Hsiung
Purchase Details
Closed on
Apr 11, 2003
Sold by
Noble Tax Investors Inc
Bought by
Casas Lisa
Purchase Details
Closed on
Jul 31, 2001
Sold by
Orr David D
Bought by
Noble Tax Investors Inc
Purchase Details
Closed on
May 10, 2000
Sold by
First Suburban National Bank
Bought by
First Suburban National Bank and Trust #9812-00
Purchase Details
Closed on
Feb 19, 1997
Sold by
Maverick Properties Inc
Bought by
First Suburban National Bank and Trust #9559-00
Create a Home Valuation Report for This Property
The Home Valuation Report is an in-depth analysis detailing your home's value as well as a comparison with similar homes in the area
Home Values in the Area
Average Home Value in this Area
Purchase History
| Date | Buyer | Sale Price | Title Company |
|---|---|---|---|
| Clemons Justin | $3,000 | Greater Illinois Title | |
| Lu Wen Hsiung | $15,000 | Rtc | |
| Casas Lisa | $10,000 | -- | |
| Casas Lisa | $10,000 | -- | |
| Noble Tax Investors Inc | -- | -- | |
| First Suburban National Bank | -- | -- | |
| First Suburban National Bank | $12,500 | -- |
Source: Public Records
Mortgage History
| Date | Status | Borrower | Loan Amount |
|---|---|---|---|
| Previous Owner | Clemons Justin | $2,171 |
Source: Public Records
Tax History Compared to Growth
Tax History
| Year | Tax Paid | Tax Assessment Tax Assessment Total Assessment is a certain percentage of the fair market value that is determined by local assessors to be the total taxable value of land and additions on the property. | Land | Improvement |
|---|---|---|---|---|
| 2024 | $943 | $5,620 | $4,531 | $1,089 |
| 2023 | $919 | $4,453 | $3,672 | $781 |
| 2022 | $919 | $4,453 | $3,672 | $781 |
| 2021 | $898 | $4,452 | $3,671 | $781 |
| 2020 | $995 | $4,452 | $3,671 | $781 |
| 2019 | $897 | $4,452 | $3,671 | $781 |
| 2018 | $882 | $4,452 | $3,671 | $781 |
| 2017 | $877 | $4,062 | $3,281 | $781 |
| 2016 | $657 | $3,281 | $3,281 | $0 |
| 2015 | $601 | $3,281 | $3,281 | $0 |
| 2014 | $580 | $3,125 | $3,125 | $0 |
| 2013 | $568 | $3,125 | $3,125 | $0 |
Source: Public Records
Map
Nearby Homes
- 1554 S Homan Ave
- 1546 S Christiana Ave
- 1549 S Trumbull Ave
- 1654 S Christiana Ave
- 1520 S Christiana Ave
- 1549 S Saint Louis Ave
- 1600 S Saint Louis Ave
- 1607 S Sawyer Ave
- 1609 S Sawyer Ave
- 1515 S Drake Ave
- 1540 S Drake Ave
- 3301 W Douglas Blvd
- 1428 S Saint Louis Ave
- 1613 S Central Park Ave
- 1839 S Drake Ave
- 1657 S Central Park Ave
- 1918 S Christiana Ave
- 1921 S Homan Ave
- 1922 S Christiana Ave
- 1813 S Central Park Ave
- 1615 S Homan Ave
- 1615 S Homan Ave
- 1609 S Homan Ave
- 1609 S Homan Ave
- 1605 S Homan Ave Unit 2
- 1605 S Homan Ave
- 1623 S Homan Ave
- 1618 S Christiana Ave
- 1625 S Homan Ave
- 3357 W 16th St
- 1629 S Homan Ave
- 1629 S Homan Ave
- 1620 S Christiana Ave Unit 2
- 1631 S Homan Ave
- 1606 S Homan Ave
- 1633 S Homan Ave Unit 3R
- 1633 S Homan Ave
- 1624 S Christiana Ave
- 1635 S Homan Ave
- 3346 W 16th St