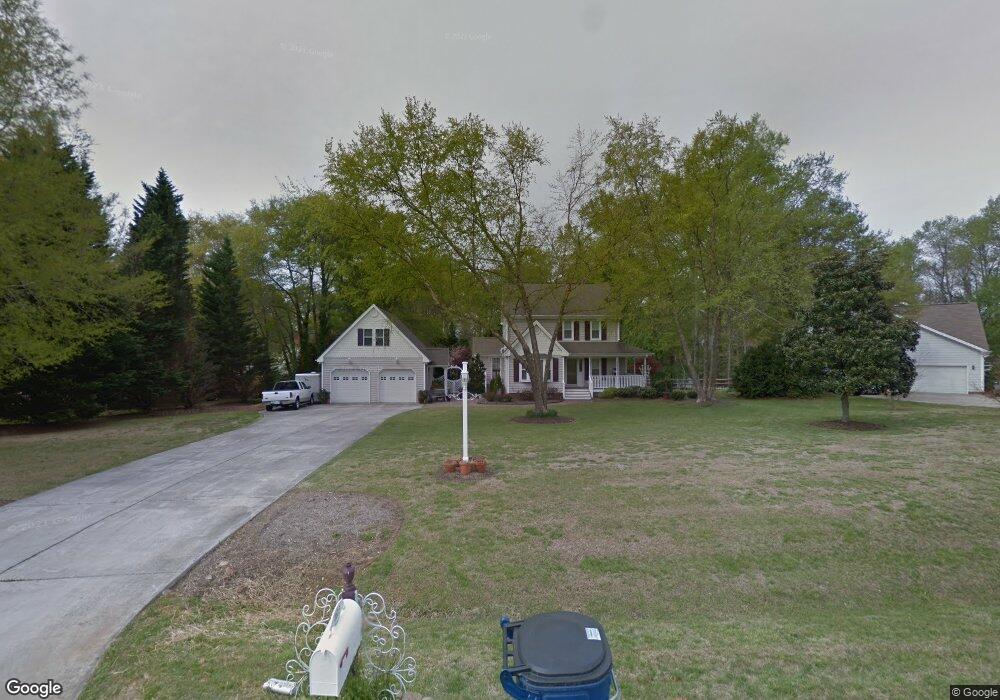
1613 Spennymore Rd Raleigh, NC 27603
Estimated Value: $371,000 - $435,000
3
Beds
3
Baths
1,776
Sq Ft
$224/Sq Ft
Est. Value
About This Home
This home is located at 1613 Spennymore Rd, Raleigh, NC 27603 and is currently estimated at $397,952, approximately $224 per square foot. 1613 Spennymore Rd is a home located in Wake County with nearby schools including Rand Road Elementary, North Garner Middle, and Garner High.
Ownership History
Date
Name
Owned For
Owner Type
Purchase Details
Closed on
Dec 13, 2019
Sold by
Pena Ruben G
Bought by
Crosby Shawn P
Current Estimated Value
Home Financials for this Owner
Home Financials are based on the most recent Mortgage that was taken out on this home.
Original Mortgage
$255,000
Outstanding Balance
$225,995
Interest Rate
3.87%
Mortgage Type
New Conventional
Estimated Equity
$171,957
Purchase Details
Closed on
Feb 22, 2016
Sold by
Roberts Glenn A and Roberts Sharon J
Bought by
Pena Ruben G
Home Financials for this Owner
Home Financials are based on the most recent Mortgage that was taken out on this home.
Original Mortgage
$193,500
Interest Rate
3.97%
Mortgage Type
New Conventional
Purchase Details
Closed on
Jan 30, 1992
Bought by
Roberts Glenn A and Roberts Sharon J
Create a Home Valuation Report for This Property
The Home Valuation Report is an in-depth analysis detailing your home's value as well as a comparison with similar homes in the area
Home Values in the Area
Average Home Value in this Area
Purchase History
| Date | Buyer | Sale Price | Title Company |
|---|---|---|---|
| Crosby Shawn P | $255,000 | None Available | |
| Pena Ruben G | $215,000 | None Available | |
| Roberts Glenn A | $106,500 | -- |
Source: Public Records
Mortgage History
| Date | Status | Borrower | Loan Amount |
|---|---|---|---|
| Open | Crosby Shawn P | $255,000 | |
| Previous Owner | Pena Ruben G | $193,500 |
Source: Public Records
Tax History Compared to Growth
Tax History
| Year | Tax Paid | Tax Assessment Tax Assessment Total Assessment is a certain percentage of the fair market value that is determined by local assessors to be the total taxable value of land and additions on the property. | Land | Improvement |
|---|---|---|---|---|
| 2025 | $2,410 | $373,645 | $80,000 | $293,645 |
| 2024 | $2,340 | $373,645 | $80,000 | $293,645 |
| 2023 | $2,010 | $255,194 | $56,000 | $199,194 |
| 2022 | $1,863 | $255,194 | $56,000 | $199,194 |
| 2021 | $1,813 | $255,194 | $56,000 | $199,194 |
| 2020 | $1,783 | $255,194 | $56,000 | $199,194 |
| 2019 | $1,735 | $210,032 | $56,000 | $154,032 |
| 2018 | $1,596 | $210,032 | $56,000 | $154,032 |
| 2017 | $1,513 | $210,032 | $56,000 | $154,032 |
| 2016 | $1,483 | $210,032 | $56,000 | $154,032 |
| 2015 | $1,609 | $228,849 | $56,000 | $172,849 |
| 2014 | $1,526 | $228,849 | $56,000 | $172,849 |
Source: Public Records
Map
Nearby Homes
- 1009 Feldmen Dr
- 1021 Wintu Ct
- 1017 Azalea Garden Cir
- 1025 Azalea Garden Cir
- 1233 Azalea Garden Cir
- 1033 Azalea Garden Cir
- 1037 Azalea Garden Cir
- 1041 Azalea Garden Cir
- 1005 Turner Meadow Dr
- 1045 Azalea Garden Cir
- 1053 Azalea Garden Cir
- 1057 Azalea Garden Cir
- 1101 Robinfield Dr
- 1061 Azalea Garden Cir
- 6501 Rock Service Station Rd
- 1065 Azalea Garden Cir
- 1069 Azalea Garden Cir
- 1220 Turner Woods Dr
- 449 Kings Hollow Dr
- 6009 Swales Way
- 1609 Spennymore Rd
- 1617 Spennymore Rd
- 1608 Spennymore Rd
- 1620 Habbot Dr
- 1605 Spennymore Rd
- 1616 Habbot Dr
- 5821 Hampton Ridge Rd
- 1612 Spennymore Rd
- 5900 Hampton Ridge Rd
- 1612 Habbot Dr
- 5904 Hampton Ridge Rd
- 5821 Heathill Ct
- 5908 Hampton Ridge Rd
- 1601 Spennymore Rd
- 5817 Heathill Ct
- 5817 Hampton Ridge Rd
- 5912 Hampton Ridge Rd
- 1608 Habbot Dr
- 1613 Habbot Dr
- 5800 Heathill Ct