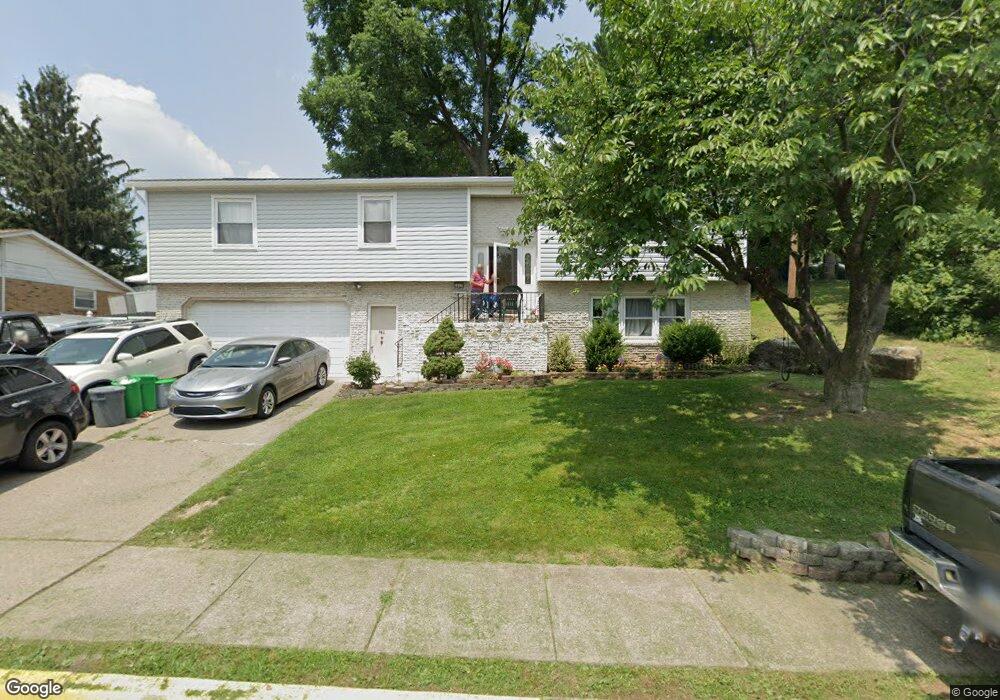
1613 W Cedar St Unit 1617 Allentown, PA 18102
Highland Park NeighborhoodEstimated Value: $337,000 - $413,000
3
Beds
3
Baths
2,238
Sq Ft
$173/Sq Ft
Est. Value
About This Home
This home is located at 1613 W Cedar St Unit 1617, Allentown, PA 18102 and is currently estimated at $387,747, approximately $173 per square foot. 1613 W Cedar St Unit 1617 is a home located in Lehigh County with nearby schools including Muhlenberg Elementary School, San Rafael Junior High School, and Trexler Middle School.
Ownership History
Date
Name
Owned For
Owner Type
Purchase Details
Closed on
Feb 29, 2024
Sold by
Hock Richard L and Hock Blanca M
Bought by
Dor Marie Nancie and Toussaint Markinzie Taylor
Current Estimated Value
Home Financials for this Owner
Home Financials are based on the most recent Mortgage that was taken out on this home.
Original Mortgage
$328,932
Outstanding Balance
$323,430
Interest Rate
6.6%
Mortgage Type
FHA
Estimated Equity
$64,317
Purchase Details
Closed on
Jul 23, 2014
Sold by
Reardon Brenda M
Bought by
Hock Richard L and Hock Blanca M
Home Financials for this Owner
Home Financials are based on the most recent Mortgage that was taken out on this home.
Original Mortgage
$162,181
Interest Rate
4.18%
Mortgage Type
VA
Purchase Details
Closed on
Oct 21, 1999
Sold by
Houser William and Houser Toni
Bought by
Reardon Brenda M
Create a Home Valuation Report for This Property
The Home Valuation Report is an in-depth analysis detailing your home's value as well as a comparison with similar homes in the area
Home Values in the Area
Average Home Value in this Area
Purchase History
| Date | Buyer | Sale Price | Title Company |
|---|---|---|---|
| Dor Marie Nancie | $335,000 | None Listed On Document | |
| Hock Richard L | $157,000 | None Available | |
| Reardon Brenda M | $100,000 | -- |
Source: Public Records
Mortgage History
| Date | Status | Borrower | Loan Amount |
|---|---|---|---|
| Open | Dor Marie Nancie | $328,932 | |
| Previous Owner | Hock Richard L | $162,181 |
Source: Public Records
Tax History Compared to Growth
Tax History
| Year | Tax Paid | Tax Assessment Tax Assessment Total Assessment is a certain percentage of the fair market value that is determined by local assessors to be the total taxable value of land and additions on the property. | Land | Improvement |
|---|---|---|---|---|
| 2025 | $6,702 | $196,800 | $32,800 | $164,000 |
| 2024 | $6,702 | $196,800 | $32,800 | $164,000 |
| 2023 | $6,702 | $196,800 | $32,800 | $164,000 |
| 2022 | $6,478 | $196,800 | $164,000 | $32,800 |
| 2021 | $6,355 | $196,800 | $32,800 | $164,000 |
| 2020 | $6,197 | $196,800 | $32,800 | $164,000 |
| 2019 | $3,722 | $196,800 | $32,800 | $164,000 |
| 2018 | $5,652 | $196,800 | $32,800 | $164,000 |
| 2017 | $5,514 | $196,800 | $32,800 | $164,000 |
| 2016 | -- | $196,800 | $32,800 | $164,000 |
| 2015 | -- | $222,600 | $32,800 | $189,800 |
| 2014 | -- | $222,600 | $32,800 | $189,800 |
Source: Public Records
Map
Nearby Homes
- 1717 W Cedar St
- 1802 W Washington St
- 638 N 16th St
- 605 N 16th St
- 605 1/2 N 16th St
- 519 N Saint George St
- 518 N Saint George St
- 1613 W Congress St Unit 1619
- 1429 W Liberty St
- 422 N Fulton St
- 2023 W Washington St
- 1357 W Liberty St
- 1009 N 13th St
- 2014 W Highland St
- 1235 Livingston St
- 329 N 15th St
- 1017 N 21st St
- 1417 W Woodlawn St Unit 1431
- 1742 W Chew St
- 1243 N 19th St
- 1615 W Cedar St
- 1619 W Cedar St Unit 1625
- 828 N 16th St Unit 838
- 1629 Cedar St
- 1624 W Cedar St
- 1627 W Cedar St Unit 1633
- 1614 W Greenleaf St Unit 1620
- 1614 W Cedar St Unit 1618
- 1620 W Cedar St Unit 1626
- 1624 W Greenleaf St
- 1608 W Greenleaf St Unit 1612
- 1628 W Cedar St Unit 1630
- 848 N 16th St
- 848 N 16th St Unit 4
- 848 N 16th St Unit 1
- 848 N 16th St Unit 2
- 1632 Greenleaf St
- 814 N 16th St
- 1633 W Cedar St Unit 1639
- 1630 W Greenleaf St Unit 1634