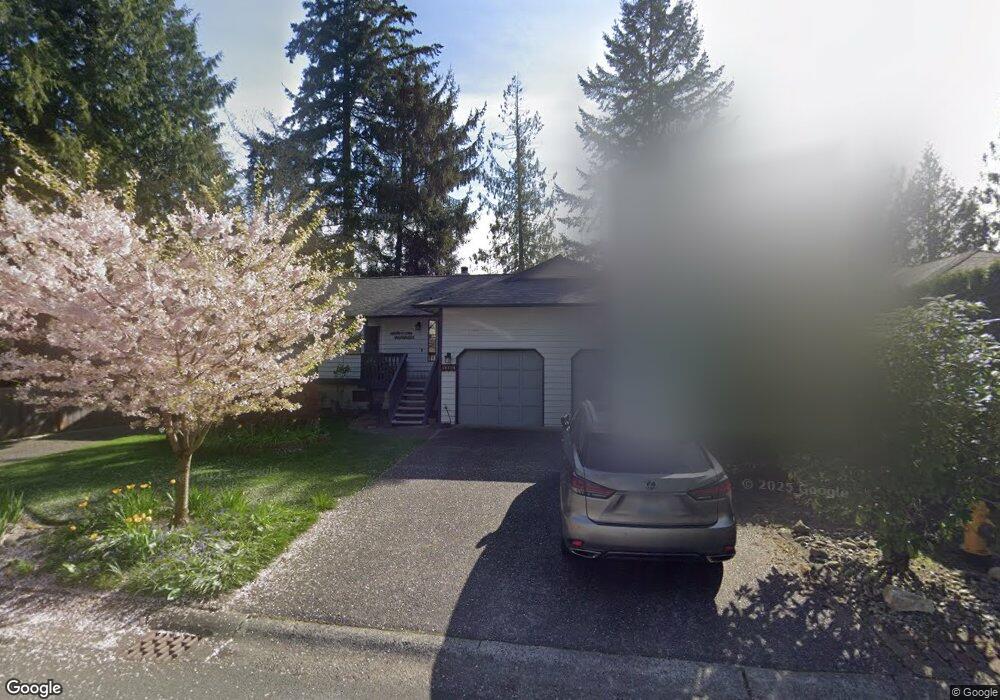
16133 4th Ave SE Bothell, WA 98012
Estimated Value: $705,897 - $866,000
3
Beds
3
Baths
1,192
Sq Ft
$672/Sq Ft
Est. Value
About This Home
This home is located at 16133 4th Ave SE, Bothell, WA 98012 and is currently estimated at $800,724, approximately $671 per square foot. 16133 4th Ave SE is a home located in Snohomish County with nearby schools including Woodside Elementary School, Heatherwood Middle School, and Henry M. Jackson High School.
Ownership History
Date
Name
Owned For
Owner Type
Purchase Details
Closed on
Nov 24, 2004
Sold by
Scrogham Diana L
Bought by
Spector Scrogham Diane Lee and Dee Spector Revocable Living Trust
Current Estimated Value
Purchase Details
Closed on
Oct 12, 2001
Sold by
Scrogham Timothy E
Bought by
Scrogham Diana L
Home Financials for this Owner
Home Financials are based on the most recent Mortgage that was taken out on this home.
Original Mortgage
$193,500
Outstanding Balance
$70,535
Interest Rate
6.87%
Mortgage Type
Purchase Money Mortgage
Estimated Equity
$730,189
Purchase Details
Closed on
Oct 22, 1997
Sold by
Chakos Justin C and Chakos Barbara J
Bought by
Scrogham Timothy E and Scrogham Diana L
Home Financials for this Owner
Home Financials are based on the most recent Mortgage that was taken out on this home.
Original Mortgage
$173,400
Interest Rate
7.49%
Mortgage Type
VA
Create a Home Valuation Report for This Property
The Home Valuation Report is an in-depth analysis detailing your home's value as well as a comparison with similar homes in the area
Home Values in the Area
Average Home Value in this Area
Purchase History
| Date | Buyer | Sale Price | Title Company |
|---|---|---|---|
| Spector Scrogham Diane Lee | -- | -- | |
| Scrogham Diana L | -- | -- | |
| Scrogham Timothy E | $170,000 | Fidelity National Title |
Source: Public Records
Mortgage History
| Date | Status | Borrower | Loan Amount |
|---|---|---|---|
| Open | Scrogham Diana L | $193,500 | |
| Closed | Scrogham Timothy E | $173,400 |
Source: Public Records
Tax History
| Year | Tax Paid | Tax Assessment Tax Assessment Total Assessment is a certain percentage of the fair market value that is determined by local assessors to be the total taxable value of land and additions on the property. | Land | Improvement |
|---|---|---|---|---|
| 2026 | $1,452 | $811,200 | $533,000 | $278,200 |
| 2025 | $1,429 | $720,900 | $450,000 | $270,900 |
| 2024 | $1,429 | $701,800 | $440,000 | $261,800 |
| 2023 | $3,828 | $910,100 | $610,000 | $300,100 |
| 2022 | $6,227 | $618,900 | $366,000 | $252,900 |
| 2020 | $5,733 | $526,800 | $305,000 | $221,800 |
| 2019 | $4,688 | $428,000 | $250,000 | $178,000 |
| 2018 | $4,770 | $379,400 | $220,000 | $159,400 |
| 2017 | $3,999 | $331,200 | $187,000 | $144,200 |
| 2016 | $3,710 | $308,200 | $170,000 | $138,200 |
| 2015 | $3,801 | $299,800 | $160,000 | $139,800 |
| 2013 | $3,168 | $236,500 | $128,000 | $108,500 |
Source: Public Records
Map
Nearby Homes
- 16230 3rd Ave SE Unit A1
- 109 161st Place SE
- 129 164th Place SE
- 107 164th St SE Unit 2103
- 107 164th St SE Unit 2-301
- 16528 2nd Park SE
- 15727 Cascadian Way
- 15 xxx 3rd Ave SE
- 17 160th Place SE
- 15 164th St SW Unit 2
- 16 160th Place SE
- 311 168th Place SE
- 11 160th Place SE
- 31 157th Ln SE
- 16719 1st Ave SE
- 16011 2nd Place W
- 16101 Bothell Everett Hwy Unit B202
- 201 156th Place SW Unit MG 13
- 231 156th Place SW Unit MG 05
- 217 156th Place SW Unit MG 09
- 16201 4th Ave SE
- 402 161st Place SE
- 16200 5th Ave SE
- 16206 5th Ave SE
- 16211 4th Ave SE
- 332 161st Place SE
- 16210 5th Ave SE
- 333 162nd Place SE
- 401 161st Place SE
- 16221 4th Ave SE
- 16214 5th Ave SE
- 415 161st Place SE
- 326 161st Place SE
- 329 162nd Place SE
- 16211 5th Ave SE
- 427 161st Place SE
- 16218 5th Ave SE
- 331 161st Place SE
- 16229 4th Ave SE
- 16105 4th Ave SE
Your Personal Tour Guide
Ask me questions while you tour the home.