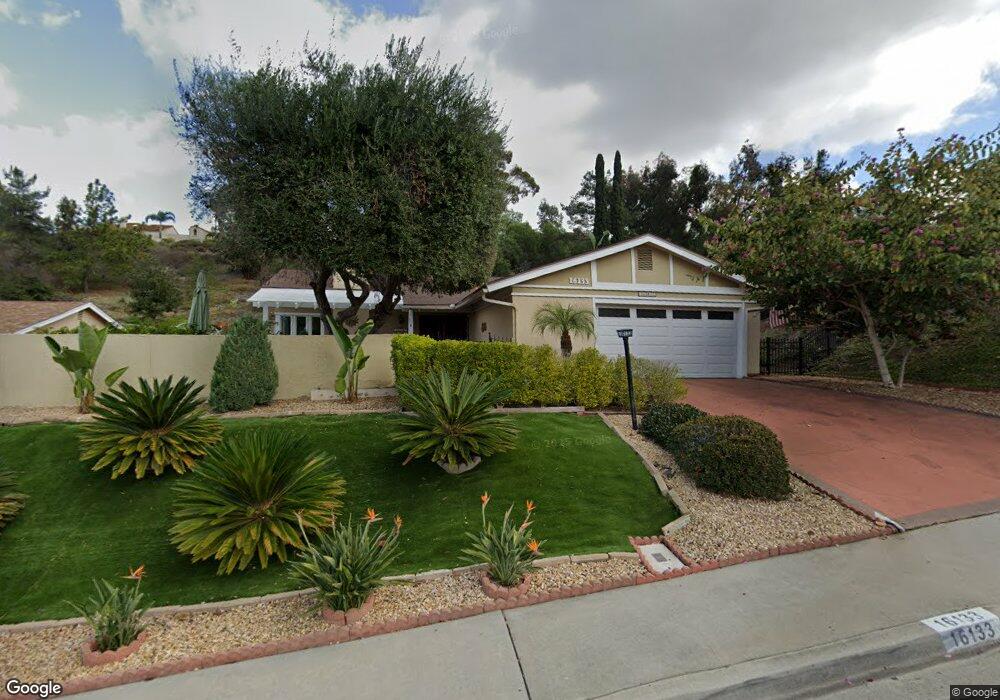
16133 Selva Dr San Diego, CA 92128
Rancho Bernardo NeighborhoodEstimated Value: $915,223 - $1,023,000
2
Beds
2
Baths
1,450
Sq Ft
$670/Sq Ft
Est. Value
About This Home
This home is located at 16133 Selva Dr, San Diego, CA 92128 and is currently estimated at $971,806, approximately $670 per square foot. 16133 Selva Dr is a home located in San Diego County with nearby schools including Highland Ranch Elementary School, Bernardo Heights Middle, and Rancho Bernardo High.
Ownership History
Date
Name
Owned For
Owner Type
Purchase Details
Closed on
May 2, 2014
Sold by
Greenlee James H and Greenlee Regina M
Bought by
Greenlee Family Trust
Current Estimated Value
Home Financials for this Owner
Home Financials are based on the most recent Mortgage that was taken out on this home.
Original Mortgage
$44,600
Outstanding Balance
$30,061
Interest Rate
4.35%
Mortgage Type
Credit Line Revolving
Estimated Equity
$941,745
Purchase Details
Closed on
Mar 8, 2013
Sold by
Trinh Steve
Bought by
Greenlee James H and Greenlee Regina M
Home Financials for this Owner
Home Financials are based on the most recent Mortgage that was taken out on this home.
Original Mortgage
$361,000
Outstanding Balance
$254,748
Interest Rate
3.54%
Mortgage Type
New Conventional
Estimated Equity
$717,058
Purchase Details
Closed on
Mar 16, 2005
Sold by
Selix Richard C
Bought by
Selix Richard C and Richard C Selix Family Trust
Purchase Details
Closed on
May 16, 1986
Create a Home Valuation Report for This Property
The Home Valuation Report is an in-depth analysis detailing your home's value as well as a comparison with similar homes in the area
Home Values in the Area
Average Home Value in this Area
Purchase History
| Date | Buyer | Sale Price | Title Company |
|---|---|---|---|
| Greenlee Family Trust | -- | Accommodation | |
| Greenlee James H | -- | Stewart Title Of Ca Inc | |
| Greenlee James H | $380,000 | Lawyers Title Ins Corp | |
| Selix Richard C | -- | -- | |
| -- | $121,000 | -- |
Source: Public Records
Mortgage History
| Date | Status | Borrower | Loan Amount |
|---|---|---|---|
| Open | Greenlee James H | $44,600 | |
| Open | Greenlee James H | $361,000 |
Source: Public Records
Tax History Compared to Growth
Tax History
| Year | Tax Paid | Tax Assessment Tax Assessment Total Assessment is a certain percentage of the fair market value that is determined by local assessors to be the total taxable value of land and additions on the property. | Land | Improvement |
|---|---|---|---|---|
| 2025 | $3,204 | $292,325 | $68,736 | $223,589 |
| 2024 | $3,204 | $286,594 | $67,389 | $219,205 |
| 2023 | $3,134 | $280,975 | $66,068 | $214,907 |
| 2022 | $3,081 | $275,467 | $64,773 | $210,694 |
| 2021 | $3,040 | $270,066 | $63,503 | $206,563 |
| 2020 | $2,998 | $267,297 | $62,852 | $204,445 |
| 2019 | $2,920 | $262,057 | $61,620 | $200,437 |
| 2018 | $2,837 | $256,919 | $60,412 | $196,507 |
| 2017 | $2,760 | $251,882 | $59,228 | $192,654 |
| 2016 | $2,702 | $246,944 | $58,067 | $188,877 |
| 2015 | $2,661 | $243,235 | $57,195 | $186,040 |
| 2014 | $2,598 | $238,471 | $56,075 | $182,396 |
Source: Public Records
Map
Nearby Homes
- 15945 Avenida Villaha Unit 32
- 16182 Selva Dr
- 12532 Paseo Lucido Unit 144
- 15913 Avenida Villaha Unit 42
- 15662 Caminito la Torre
- 15818 Caminito Aire Puro
- 12486 Lomica Dr
- 16021 Pomerado Rd
- 12552 Lomica Dr
- 12494 Senda Rd
- 12640 Mantilla Rd
- 12290 Corte Sabio Unit 3101
- 15617 Caldas de Reyes
- 12365 Horado Rd
- 12257 Avenida Consentido
- 15662 Via Calanova
- 12623 Calle Charmona
- 16422 Roca Dr
- 16413 Roca Dr
- 12206 Fairway Pointe Row
- 16139 Selva Dr
- 16127 Selva Dr
- 16143 Selva Dr
- 16121 Selva Dr
- 16134 Selva Dr
- 16138 Selva Dr
- 16128 Selva Dr
- 16149 Selva Dr Unit 17
- 16142 Selva Dr
- 16115 Selva Dr
- 16122 Selva Dr
- 16148 Selva Dr
- 15945 Avenida Villaha Unit 34
- 15945 Avenida Villaha Unit 33
- 15945 Avenida Villaha Unit 31
- 16109 Selva Dr
- 16155 Selva Dr
- 15969 Avenida Villaha
- 16118 Selva Dr
- 12443 Filera Rd