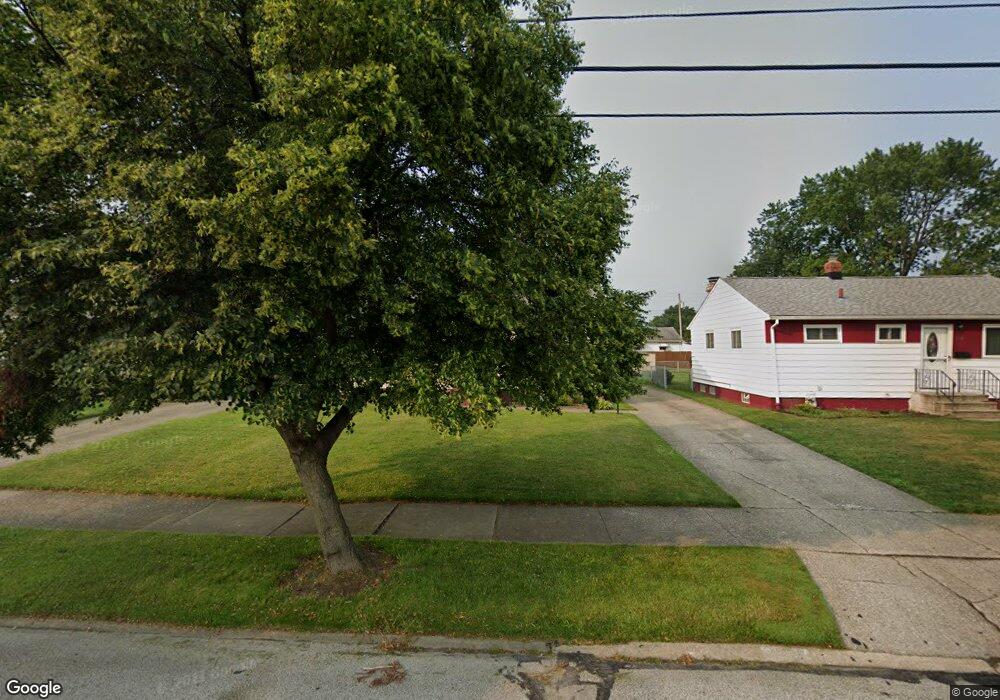
16135 Hocking Blvd Brookpark, OH 44142
Estimated Value: $169,078 - $240,000
3
Beds
1
Bath
884
Sq Ft
$221/Sq Ft
Est. Value
About This Home
This home is located at 16135 Hocking Blvd, Brookpark, OH 44142 and is currently estimated at $195,520, approximately $221 per square foot. 16135 Hocking Blvd is a home located in Cuyahoga County with nearby schools including Berea-Midpark Middle School, Berea-Midpark High School, and Huber Heights Preparatory Academy Parma Academy.
Ownership History
Date
Name
Owned For
Owner Type
Purchase Details
Closed on
Jan 19, 2022
Sold by
Manning Catherine A and Manning Glenn E
Bought by
Manning Glenn E and Manning Catherine A
Current Estimated Value
Home Financials for this Owner
Home Financials are based on the most recent Mortgage that was taken out on this home.
Original Mortgage
$131,766
Interest Rate
3.45%
Mortgage Type
FHA
Purchase Details
Closed on
Aug 18, 2014
Sold by
Estate Of Eugene J Wardle
Bought by
Wardle Eugene J and Wardle Keith
Purchase Details
Closed on
Nov 12, 2013
Sold by
Wardle Eugene J and Wardle Keith
Bought by
Manning Catherine A
Purchase Details
Closed on
Sep 17, 2009
Sold by
Wardle Eugene John and Wardle Dorothy C
Bought by
Wardle Eugene John and Wardle Dorothy C
Purchase Details
Closed on
Jan 1, 1975
Bought by
Wardle Eugene J and Wardle Dorothy C
Create a Home Valuation Report for This Property
The Home Valuation Report is an in-depth analysis detailing your home's value as well as a comparison with similar homes in the area
Home Values in the Area
Average Home Value in this Area
Purchase History
| Date | Buyer | Sale Price | Title Company |
|---|---|---|---|
| Manning Glenn E | -- | Title Clearing & Escrow Llc | |
| Wardle Eugene J | -- | Attorney | |
| Manning Catherine A | -- | Attorney | |
| Wardle Eugene John | -- | Attorney | |
| Wardle Eugene J | -- | -- |
Source: Public Records
Mortgage History
| Date | Status | Borrower | Loan Amount |
|---|---|---|---|
| Previous Owner | Manning Glenn E | $131,766 |
Source: Public Records
Tax History
| Year | Tax Paid | Tax Assessment Tax Assessment Total Assessment is a certain percentage of the fair market value that is determined by local assessors to be the total taxable value of land and additions on the property. | Land | Improvement |
|---|---|---|---|---|
| 2024 | $2,876 | $57,015 | $11,200 | $45,815 |
| 2023 | $2,561 | $42,040 | $8,160 | $33,880 |
| 2022 | $2,543 | $42,040 | $8,160 | $33,880 |
| 2021 | $2,528 | $42,040 | $8,160 | $33,880 |
| 2020 | $2,279 | $33,360 | $6,480 | $26,880 |
| 2019 | $2,211 | $95,300 | $18,500 | $76,800 |
| 2018 | $2,201 | $33,360 | $6,480 | $26,880 |
| 2017 | $2,196 | $30,740 | $6,340 | $24,400 |
| 2016 | $2,178 | $30,740 | $6,340 | $24,400 |
| 2015 | $2,208 | $30,740 | $6,340 | $24,400 |
| 2014 | $2,208 | $32,350 | $6,690 | $25,660 |
Source: Public Records
Map
Nearby Homes
- 16117 Hocking Blvd
- 16001 Sylvia Dr
- 15472 Meigs Blvd
- 15532 Rademaker Dr
- 15995 Hummel Rd
- 16379 Hummel Rd
- 6040 Slater Dr
- 15497 Hummel Rd
- 6131 Hardin Dr
- 15633 Harrison Dr
- 6363 Lockhaven Dr
- 5727 Gateway Ln Unit 1203
- 6014 Westbrook Dr
- 6213 Siegler Dr
- 6210 Siegler Dr
- 6572 Liberty Bell Dr Unit 23C
- 14024 Donald Dr
- 15504 Roxboro Dr
- 13874 Heatherwood Dr
- 6490 Grosse Dr
- 16161 Hocking Blvd
- 16091 Hocking Blvd
- 16185 Hocking Blvd
- 16190 Paulding Blvd
- 16170 Paulding Blvd
- 16208 Paulding Blvd
- 16069 Hocking Blvd
- 16207 Hocking Blvd
- 16234 Paulding Blvd
- 16146 Paulding Blvd
- 16128 Hocking Blvd
- 16104 Hocking Blvd
- 16150 Hocking Blvd
- 16126 Paulding Blvd
- 16082 Hocking Blvd
- 16264 Paulding Blvd
- 16045 Hocking Blvd
- 16245 Hocking Blvd
- 16060 Hocking Blvd
- 16178 Hocking Blvd