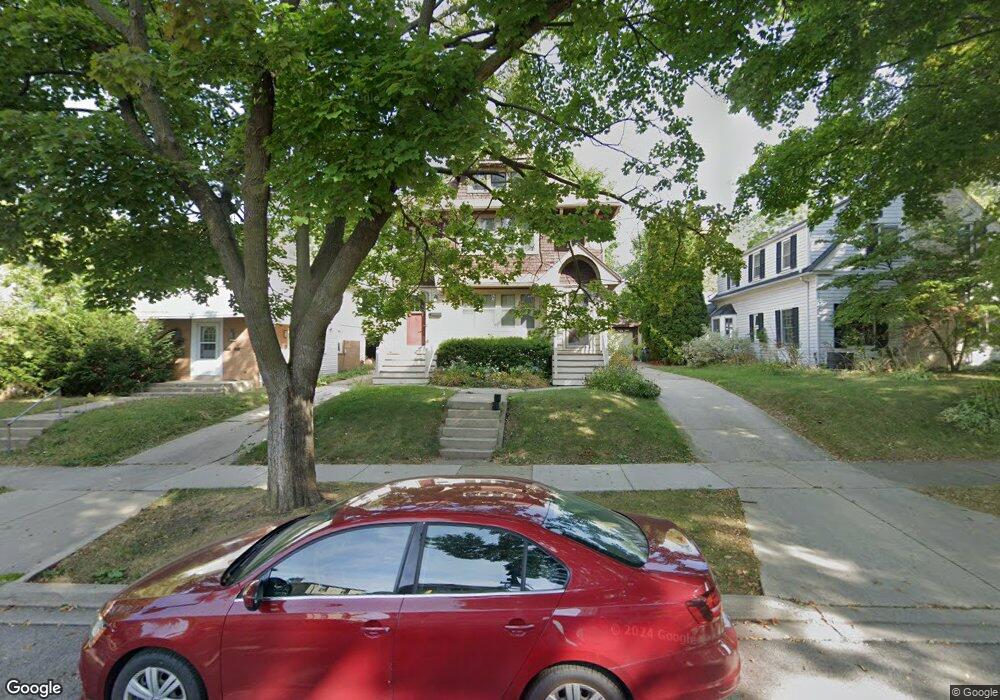
1614 E Beverly Rd Unit 1616 Milwaukee, WI 53211
Estimated Value: $429,000 - $493,000
4
Beds
2
Baths
2,510
Sq Ft
$183/Sq Ft
Est. Value
About This Home
This home is located at 1614 E Beverly Rd Unit 1616, Milwaukee, WI 53211 and is currently estimated at $459,659, approximately $183 per square foot. 1614 E Beverly Rd Unit 1616 is a home located in Milwaukee County with nearby schools including Atwater Elementary School, Shorewood Intermediate School, and Shorewood High School.
Ownership History
Date
Name
Owned For
Owner Type
Purchase Details
Closed on
Sep 24, 2011
Sold by
Steck Robert A and Steck Marney L
Bought by
Steck Marney L
Current Estimated Value
Purchase Details
Closed on
Feb 16, 2004
Sold by
Shimek Marney L and Steck Marney L
Bought by
Steck Robert A and Steck Marney L
Home Financials for this Owner
Home Financials are based on the most recent Mortgage that was taken out on this home.
Original Mortgage
$216,000
Outstanding Balance
$100,458
Interest Rate
5.71%
Mortgage Type
Commercial
Estimated Equity
$359,201
Purchase Details
Closed on
Mar 1, 1999
Sold by
Radke Thomas J and Radke Felicia H
Bought by
Shimek Marney L
Home Financials for this Owner
Home Financials are based on the most recent Mortgage that was taken out on this home.
Original Mortgage
$148,500
Interest Rate
6.78%
Mortgage Type
Commercial
Create a Home Valuation Report for This Property
The Home Valuation Report is an in-depth analysis detailing your home's value as well as a comparison with similar homes in the area
Home Values in the Area
Average Home Value in this Area
Purchase History
| Date | Buyer | Sale Price | Title Company |
|---|---|---|---|
| Steck Marney L | -- | None Available | |
| Steck Robert A | -- | Metropolitan Title Company | |
| Shimek Marney L | $165,000 | -- |
Source: Public Records
Mortgage History
| Date | Status | Borrower | Loan Amount |
|---|---|---|---|
| Open | Steck Robert A | $216,000 | |
| Closed | Shimek Marney L | $148,500 |
Source: Public Records
Tax History Compared to Growth
Tax History
| Year | Tax Paid | Tax Assessment Tax Assessment Total Assessment is a certain percentage of the fair market value that is determined by local assessors to be the total taxable value of land and additions on the property. | Land | Improvement |
|---|---|---|---|---|
| 2024 | $3,851 | $355,900 | $88,900 | $267,000 |
| 2023 | -- | $344,900 | $77,900 | $267,000 |
| 2022 | -- | $299,600 | $77,900 | $221,700 |
| 2021 | $7,893 | $299,600 | $221,700 | $77,900 |
| 2020 | $7,280 | $268,900 | $77,900 | $191,000 |
| 2019 | $7,192 | $268,900 | $77,900 | $191,000 |
| 2018 | $0 | $252,700 | $77,900 | $174,800 |
| 2017 | $7,028 | $252,700 | $77,900 | $174,800 |
| 2016 | $7,028 | $252,700 | $77,900 | $174,800 |
| 2015 | $6,814 | $249,000 | $77,900 | $171,100 |
| 2014 | $7,267 | $275,100 | $77,900 | $197,200 |
| 2013 | $7,040 | $275,100 | $77,900 | $197,200 |
Source: Public Records
Map
Nearby Homes
- 1633 E Newton Ave
- 3731 N Morris Blvd
- 3916 N Oakland Ave Unit 224
- 1818 E Shorewood Blvd Unit 310
- 1818 E Shorewood Blvd Unit 207
- 3575 N Oakland Ave
- 1921 E Elmdale Ct
- 3563 N Maryland Ave Unit 65
- 4111 N Woodburn St Unit 13
- 1311 E Randolph Ct Unit C
- 3369 N Bartlett Ave
- 3374 N Cramer St Unit 3374
- 4313 N Morris Blvd
- 4045 N Stowell Ave
- 3480 N Bremen St
- 4339 N Alpine Ave
- 4151 N Prospect Ave
- 4042 N Downer Ave Unit 44
- 3277 N Humboldt Blvd
- 2730 E Menlo Blvd
- 1610 E Beverly Rd
- 1610 E Beverly Rd Unit 1612
- 1610/1612 E Beverly Rd
- 1604 E Beverly Rd Unit 6
- 1604 E Beverly Rd Unit 1606
- 3805 N Bartlett Ave
- 3813 N Bartlett Ave
- 1619 E Beverly Rd Unit 21
- 3810 N Newhall St
- 3800 N Newhall St
- 3817 N Bartlett Ave
- 1607 E Beverly Rd
- 1623 E Beverly Rd
- 1627 E Beverly Rd
- 1601 E Beverly Rd Unit 3
- 3816 N Newhall St
- 3821 N Bartlett Ave
- 1615/1615A E Beverly Rd
- 3820 N Newhall St
- 1609/1611 E Beverly Rd