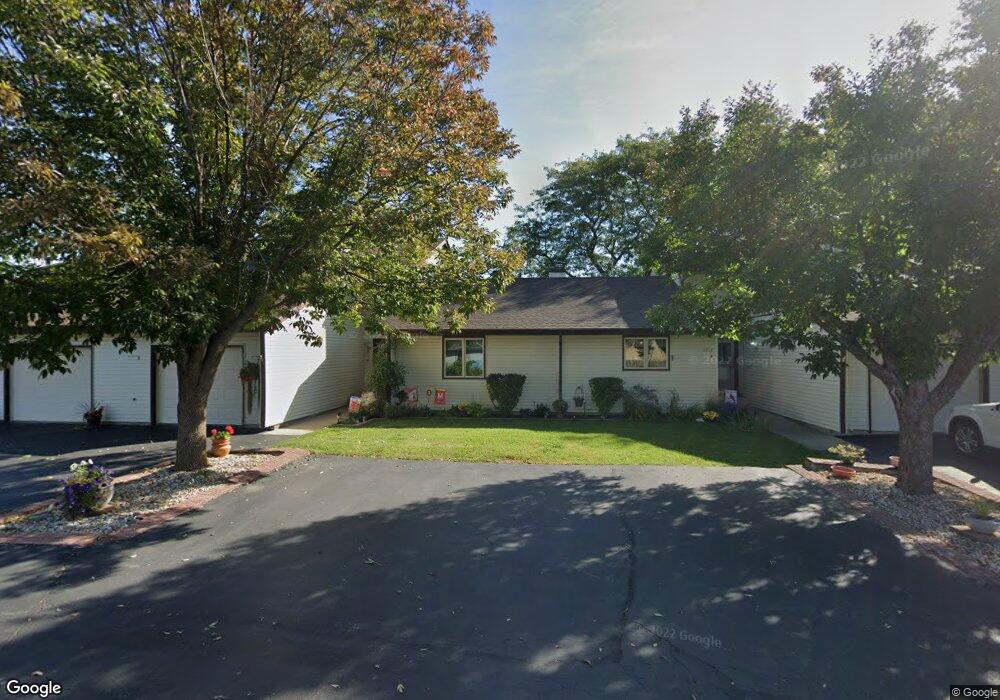
1614 Gingercreek Ct Unit 163 Sycamore, IL 60178
Estimated Value: $162,248 - $197,000
1
Bed
1
Bath
980
Sq Ft
$186/Sq Ft
Est. Value
About This Home
This home is located at 1614 Gingercreek Ct Unit 163, Sycamore, IL 60178 and is currently estimated at $182,062, approximately $185 per square foot. 1614 Gingercreek Ct Unit 163 is a home located in DeKalb County with nearby schools including Sycamore High School, Cornerstone Christian Academy, and St Mary's Catholic School.
Ownership History
Date
Name
Owned For
Owner Type
Purchase Details
Closed on
Dec 18, 2019
Sold by
Cheney Stephanie and Barbara Ann Walker Trust
Bought by
Walker Michael P and Walker Michael P
Current Estimated Value
Purchase Details
Closed on
Dec 13, 2013
Sold by
Walker Barbara A
Bought by
Walker Barbara Ann
Create a Home Valuation Report for This Property
The Home Valuation Report is an in-depth analysis detailing your home's value as well as a comparison with similar homes in the area
Home Values in the Area
Average Home Value in this Area
Purchase History
| Date | Buyer | Sale Price | Title Company |
|---|---|---|---|
| Walker Michael P | -- | None Available | |
| Walker Barbara Ann | -- | -- |
Source: Public Records
Tax History Compared to Growth
Tax History
| Year | Tax Paid | Tax Assessment Tax Assessment Total Assessment is a certain percentage of the fair market value that is determined by local assessors to be the total taxable value of land and additions on the property. | Land | Improvement |
|---|---|---|---|---|
| 2024 | $1,298 | $49,351 | $5,961 | $43,390 |
| 2023 | $1,298 | $46,170 | $5,577 | $40,593 |
| 2022 | $1,359 | $44,064 | $5,323 | $38,741 |
| 2021 | $1,384 | $36,272 | $5,068 | $31,204 |
| 2020 | $1,402 | $35,141 | $4,910 | $30,231 |
| 2019 | $1,414 | $33,388 | $4,704 | $28,684 |
| 2018 | $1,440 | $31,576 | $4,449 | $27,127 |
| 2017 | $1,468 | $30,061 | $4,236 | $25,825 |
| 2016 | $1,508 | $28,253 | $3,981 | $24,272 |
| 2015 | -- | $26,531 | $3,738 | $22,793 |
| 2014 | -- | $25,535 | $3,598 | $21,937 |
| 2013 | -- | $26,461 | $3,728 | $22,733 |
Source: Public Records
Map
Nearby Homes
- 1729 Raintree Ct Unit 92
- 1721 Cedarbrook Ct Unit 1
- Lots 1 & 2 Dekalb Ave
- Lots 700-900 Ridge Dr
- 2123 Fairland Dr
- 0000 Coltonville Rd
- 1235 Hathaway Dr
- 1606 E Stonehenge Dr
- 625 Anjali Ct Unit L
- 617 Anjali Ct
- 1208 Foxpointe Dr
- 610 Anjali Ct Unit R
- 608 Anjali Ct Unit L
- 932 Foxpointe Dr
- 505 Anjali Ct
- Lot 4 W Prairie Dr
- Lot 7 Aberdeen Ct
- Lot 104 Aberdeen Ct
- 419 Anjali Ct Unit R
- 404 Anjali Ct Unit L
- 1612 Gingercreek Ct Unit 162
- 1616 Gingercreek Ct Unit 164
- 1618 Gingercreek Ct Unit 165
- 1610 Gingercreek Ct Unit 161
- 1620 Gingercreek Ct Unit 166
- 1606 Gingercreek Ct Unit 152
- 1604 Gingercreek Ct Unit 151
- 1601 Longwood Dr
- 1815 Meadowbrook Ct
- 1602 Longwood Dr
- 1622 Gingercreek Ct Unit 167
- 1815 Raintree Ct Unit 54
- 1818 Meadowbrook Ct
- 1813 Raintree Ct Unit 53
- 1811 Raintree Ct Unit 52
- 1809 Raintree Ct Unit 51
- 1551 Longwood Dr
- 1624 Gingercreek Ct Unit 168
- 1626 Gingercreek Ct Unit 169
- 1608 Longwood Dr