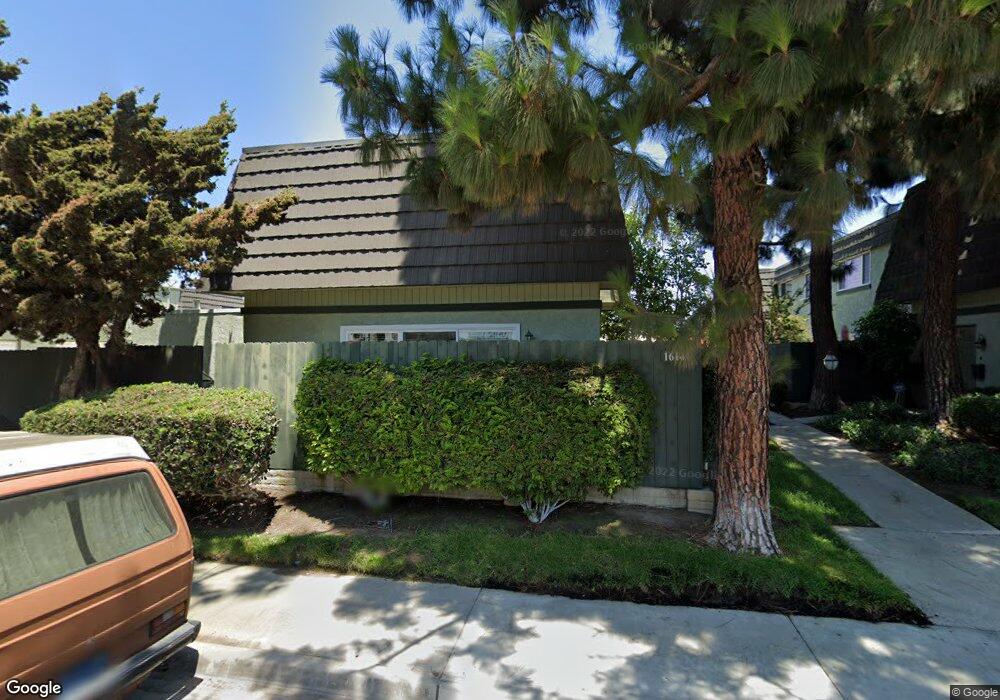
1614 Iowa St Unit B Costa Mesa, CA 92626
Mesa Verde NeighborhoodEstimated Value: $636,334 - $662,000
2
Beds
1
Bath
890
Sq Ft
$729/Sq Ft
Est. Value
About This Home
This home is located at 1614 Iowa St Unit B, Costa Mesa, CA 92626 and is currently estimated at $648,834, approximately $729 per square foot. 1614 Iowa St Unit B is a home located in Orange County with nearby schools including California Elementary School, Charles W. Tewinkle Middle School, and Estancia High School.
Ownership History
Date
Name
Owned For
Owner Type
Purchase Details
Closed on
Jul 10, 1997
Sold by
Hud
Bought by
Parrish Justin
Current Estimated Value
Home Financials for this Owner
Home Financials are based on the most recent Mortgage that was taken out on this home.
Original Mortgage
$98,055
Outstanding Balance
$14,151
Interest Rate
7.58%
Mortgage Type
FHA
Estimated Equity
$634,683
Purchase Details
Closed on
Jul 8, 1996
Sold by
Lentz Donald R
Bought by
Prokop Shari A
Purchase Details
Closed on
Jun 25, 1996
Sold by
Boatmens National Mtg Inc
Bought by
Hud
Purchase Details
Closed on
Jun 19, 1996
Sold by
Alarcon John D and Alarcon Sonya C
Bought by
Boatmens National Mtg Inc
Purchase Details
Closed on
Jun 18, 1996
Sold by
Alarcon John D
Bought by
Lentz Donald R
Create a Home Valuation Report for This Property
The Home Valuation Report is an in-depth analysis detailing your home's value as well as a comparison with similar homes in the area
Home Values in the Area
Average Home Value in this Area
Purchase History
| Date | Buyer | Sale Price | Title Company |
|---|---|---|---|
| Parrish Justin | $101,500 | First American Title Ins Co | |
| Prokop Shari A | -- | -- | |
| Hud | -- | First Southwestern Title Co | |
| Boatmens National Mtg Inc | $140,555 | First Southwestern Title Co | |
| Lentz Donald R | -- | -- |
Source: Public Records
Mortgage History
| Date | Status | Borrower | Loan Amount |
|---|---|---|---|
| Open | Parrish Justin | $98,055 |
Source: Public Records
Tax History Compared to Growth
Tax History
| Year | Tax Paid | Tax Assessment Tax Assessment Total Assessment is a certain percentage of the fair market value that is determined by local assessors to be the total taxable value of land and additions on the property. | Land | Improvement |
|---|---|---|---|---|
| 2025 | $2,204 | $161,399 | $93,693 | $67,706 |
| 2024 | $2,204 | $158,235 | $91,856 | $66,379 |
| 2023 | $2,127 | $155,133 | $90,055 | $65,078 |
| 2022 | $2,021 | $152,092 | $88,290 | $63,802 |
| 2021 | $1,946 | $149,110 | $86,559 | $62,551 |
| 2020 | $1,927 | $147,582 | $85,672 | $61,910 |
| 2019 | $1,894 | $144,689 | $83,992 | $60,697 |
| 2018 | $1,860 | $141,852 | $82,345 | $59,507 |
| 2017 | $1,829 | $139,071 | $80,730 | $58,341 |
| 2016 | $1,790 | $136,345 | $79,147 | $57,198 |
| 2015 | $1,769 | $134,297 | $77,958 | $56,339 |
| 2014 | $1,692 | $131,667 | $76,431 | $55,236 |
Source: Public Records
Map
Nearby Homes
- 1387 Garlingford St
- 3149 Sharon Ln
- 3104 Samoa Place
- 3109 Barbados Place
- 3133 Bermuda Dr
- 1722 New Hampshire Dr
- 1585 Baker St
- 1714 Labrador Dr
- 3351 Via Trentino Unit 76
- 2976 Royal Palm Dr
- 2957 Royal Palm Dr
- 3295 Iowa St
- 2901 Royal Palm Dr
- 3424 Summerset Cir
- 3000 Country Club Dr
- 1174 Kingston St
- 1081 Tulare Dr
- 1878 Tahiti Dr
- 1110 Redding Ave
- 1879 Tahiti Dr
- 1614 Iowa St Unit 1
- 1614 Iowa St Unit D
- 1610 Iowa St Unit B
- 1610 Iowa St Unit C
- 1610 Iowa St Unit A
- 1614 Iowa St Unit A
- 1610 Iowa St Unit D
- 1614 Iowa St Unit C
- 1600 Iowa St Unit C
- 1600 Iowa St Unit D
- 1600 Iowa St Unit B
- 1612 Iowa St Unit C
- 1612 Iowa St Unit B
- 1612 Iowa St Unit D
- 1612 Iowa St Unit A
- 1616 Iowa St Unit B
- 1616 Iowa St Unit D
- 1616 Iowa St Unit A
- 1616 Iowa St Unit C
- 1620 Iowa St Unit A