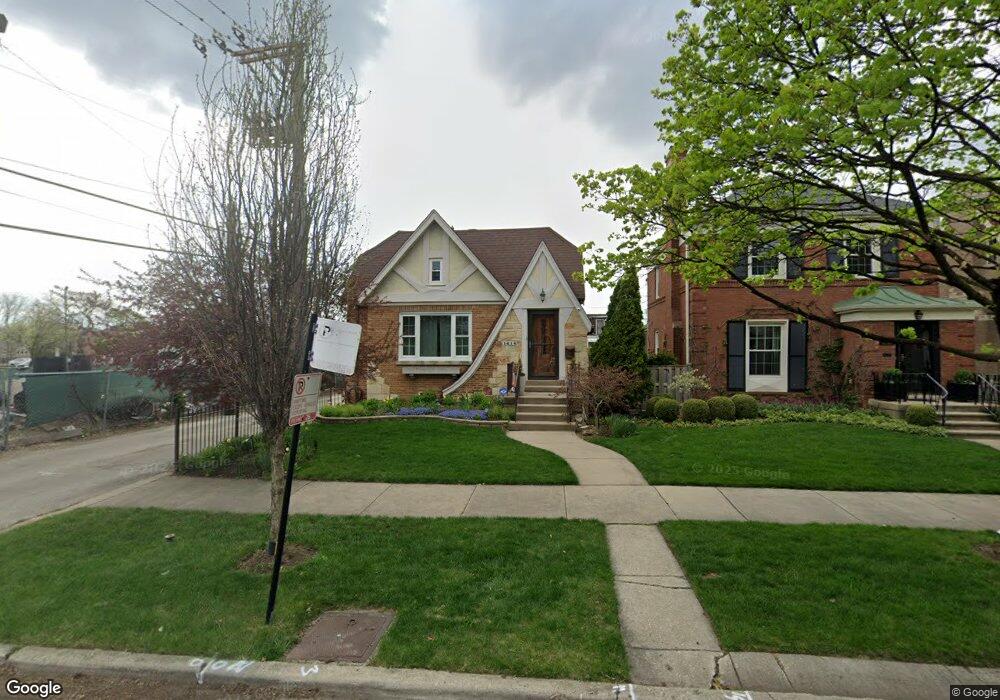
1614 N Natoma Ave Chicago, IL 60707
Galewood NeighborhoodEstimated Value: $335,000 - $432,000
2
Beds
2
Baths
1,220
Sq Ft
$317/Sq Ft
Est. Value
About This Home
This home is located at 1614 N Natoma Ave, Chicago, IL 60707 and is currently estimated at $387,341, approximately $317 per square foot. 1614 N Natoma Ave is a home located in Cook County with nearby schools including Sayre Elementary Language Academy, Steinmetz College Prep, and Acero - Roberto Clemente Elementary School.
Ownership History
Date
Name
Owned For
Owner Type
Purchase Details
Closed on
May 30, 2008
Sold by
Lubawy Martin J
Bought by
Atansio Lisa and Caranding Marie
Current Estimated Value
Home Financials for this Owner
Home Financials are based on the most recent Mortgage that was taken out on this home.
Original Mortgage
$248,880
Outstanding Balance
$160,032
Interest Rate
6.09%
Mortgage Type
Unknown
Estimated Equity
$227,309
Purchase Details
Closed on
Feb 5, 2001
Sold by
Lubawy Susan A
Bought by
Lubawy Martin J
Home Financials for this Owner
Home Financials are based on the most recent Mortgage that was taken out on this home.
Original Mortgage
$147,000
Interest Rate
7.03%
Purchase Details
Closed on
May 26, 1994
Sold by
Bugielski Thomas L and Bugielski Kathleen M
Bought by
Lubawy Martin J and Lubawy Susan A
Home Financials for this Owner
Home Financials are based on the most recent Mortgage that was taken out on this home.
Original Mortgage
$131,050
Interest Rate
8.48%
Mortgage Type
FHA
Create a Home Valuation Report for This Property
The Home Valuation Report is an in-depth analysis detailing your home's value as well as a comparison with similar homes in the area
Home Values in the Area
Average Home Value in this Area
Purchase History
| Date | Buyer | Sale Price | Title Company |
|---|---|---|---|
| Atansio Lisa | $311,500 | Pntn | |
| Lubawy Martin J | -- | -- | |
| Lubawy Martin J | $133,000 | -- |
Source: Public Records
Mortgage History
| Date | Status | Borrower | Loan Amount |
|---|---|---|---|
| Open | Atansio Lisa | $248,880 | |
| Previous Owner | Lubawy Martin J | $147,000 | |
| Previous Owner | Lubawy Martin J | $131,050 |
Source: Public Records
Tax History Compared to Growth
Tax History
| Year | Tax Paid | Tax Assessment Tax Assessment Total Assessment is a certain percentage of the fair market value that is determined by local assessors to be the total taxable value of land and additions on the property. | Land | Improvement |
|---|---|---|---|---|
| 2024 | $4,934 | $31,000 | $11,718 | $19,282 |
| 2023 | $4,789 | $26,689 | $9,450 | $17,239 |
| 2022 | $4,789 | $26,689 | $9,450 | $17,239 |
| 2021 | $4,700 | $26,689 | $9,450 | $17,239 |
| 2020 | $4,237 | $22,111 | $4,725 | $17,386 |
| 2019 | $4,305 | $24,844 | $4,725 | $20,119 |
| 2018 | $4,231 | $24,844 | $4,725 | $20,119 |
| 2017 | $3,946 | $21,694 | $4,158 | $17,536 |
| 2016 | $3,847 | $21,694 | $4,158 | $17,536 |
| 2015 | $3,497 | $21,694 | $4,158 | $17,536 |
| 2014 | $3,669 | $22,331 | $3,780 | $18,551 |
| 2013 | $3,586 | $22,331 | $3,780 | $18,551 |
Source: Public Records
Map
Nearby Homes
- 1639 N Normandy Ave
- 1700 N Natoma Ave
- 1227 N East Ave
- 1733 N Oak Park Ave
- 1600 N New England Ave Unit 4
- 1104 Fair Oaks Ave
- 1130 N Grove Ave
- 1701 N Newland Ave
- 1221 Edmer Ave
- 1627 N Narragansett Ave
- 1916 N Rutherford Ave
- 1937 N Normandy Ave
- 1009 N Oak Park Ave
- 1143 Woodbine Ave
- 1941 N New England Ave
- 1122 N Ridgeland Ave
- 925 Linden Ave
- 1212 N Harvey Ave
- 1221 Hayes Ave
- 936 N Ridgeland Ave
- 1618 N Natoma Ave
- 1622 N Natoma Ave
- 1626 N Natoma Ave
- 1615 N Normandy Ave
- 1628 N Natoma Ave
- 1619 N Normandy Ave
- 1623 N Normandy Ave
- 1625 N Normandy Ave
- 1632 N Natoma Ave
- 1615 N Natoma Ave
- 1619 N Natoma Ave
- 1629 N Normandy Ave
- 1621 N Natoma Ave
- 1636 N Natoma Ave
- 1625 N Natoma Ave
- 1633 N Normandy Ave
- 6309-09 W North Ave
- 1629 N Natoma Ave
- 1638 N Natoma Ave
- 1637 N Normandy Ave