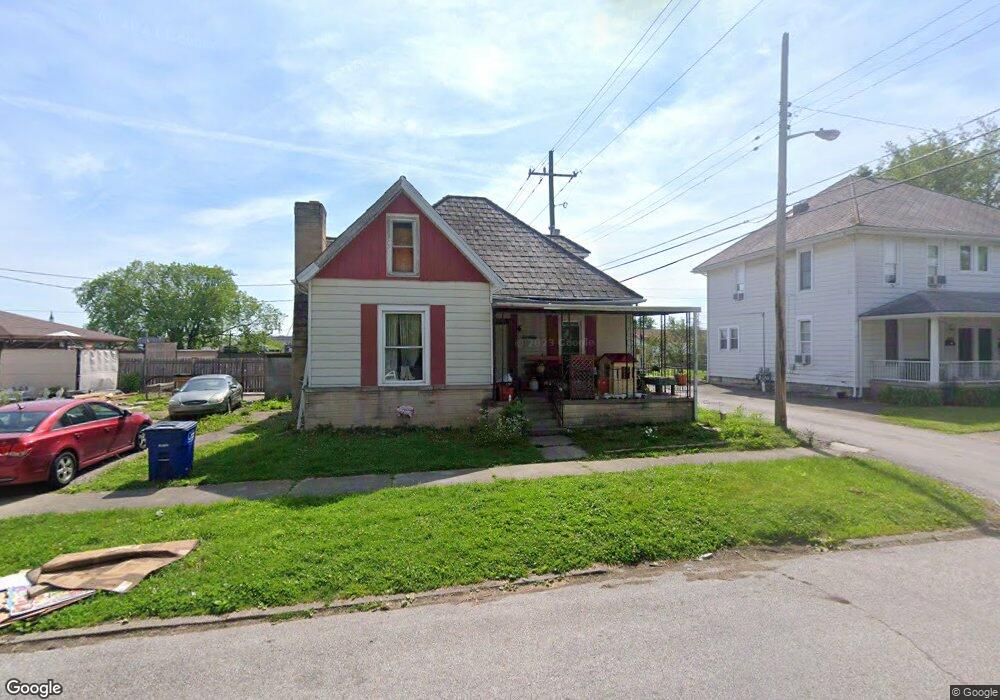
1614 N St Bedford, IN 47421
Estimated Value: $148,000 - $217,000
4
Beds
2
Baths
1,610
Sq Ft
$113/Sq Ft
Est. Value
About This Home
This home is located at 1614 N St, Bedford, IN 47421 and is currently estimated at $181,209, approximately $112 per square foot. 1614 N St is a home located in Lawrence County with nearby schools including Bedford North Lawrence High School, St. Vincent de Paul School, and Stone City Christian Academy.
Ownership History
Date
Name
Owned For
Owner Type
Purchase Details
Closed on
Mar 29, 2018
Sold by
Harbour Lp
Bought by
Headlands G
Current Estimated Value
Purchase Details
Closed on
Jan 24, 2011
Sold by
Fannie
Bought by
Not Provided
Purchase Details
Closed on
Jul 13, 2010
Sold by
Sam J Craig
Bought by
Fannie Mae
Purchase Details
Closed on
Sep 25, 2006
Sold by
Scott Free Lnvestments Llc
Bought by
Miller Edward R and Miller Stacy A
Purchase Details
Closed on
May 21, 2006
Sold by
Miller Farm Rentals Llc
Bought by
Miller Stacy A
Create a Home Valuation Report for This Property
The Home Valuation Report is an in-depth analysis detailing your home's value as well as a comparison with similar homes in the area
Home Values in the Area
Average Home Value in this Area
Purchase History
| Date | Buyer | Sale Price | Title Company |
|---|---|---|---|
| Headlands G | $26,300 | -- | |
| Headlands Asset Mgmt Fund | $26,336 | -- | |
| Not Provided | $10,343 | Nreis | |
| Fannie Mae | $58,700 | Reisenfeld & Associates Lpa Ll | |
| Miller Edward R | $137,000 | Stone Clty Tltle Company | |
| Miller Stacy A | -- | -- |
Source: Public Records
Tax History
| Year | Tax Paid | Tax Assessment Tax Assessment Total Assessment is a certain percentage of the fair market value that is determined by local assessors to be the total taxable value of land and additions on the property. | Land | Improvement |
|---|---|---|---|---|
| 2025 | $1,382 | $72,300 | $7,900 | $64,400 |
| 2024 | $1,382 | $69,100 | $7,700 | $61,400 |
| 2023 | $1,232 | $61,600 | $7,400 | $54,200 |
| 2022 | $1,152 | $57,600 | $7,200 | $50,400 |
| 2021 | $1,046 | $52,300 | $7,000 | $45,300 |
| 2020 | $984 | $49,200 | $6,700 | $42,500 |
| 2019 | $936 | $46,800 | $6,600 | $40,200 |
| 2018 | $908 | $45,400 | $6,400 | $39,000 |
| 2017 | $866 | $43,300 | $6,300 | $37,000 |
| 2016 | $1,168 | $58,400 | $6,100 | $52,300 |
| 2014 | $1,142 | $57,100 | $6,100 | $51,000 |
Source: Public Records
Map
Nearby Homes
Your Personal Tour Guide
Ask me questions while you tour the home.