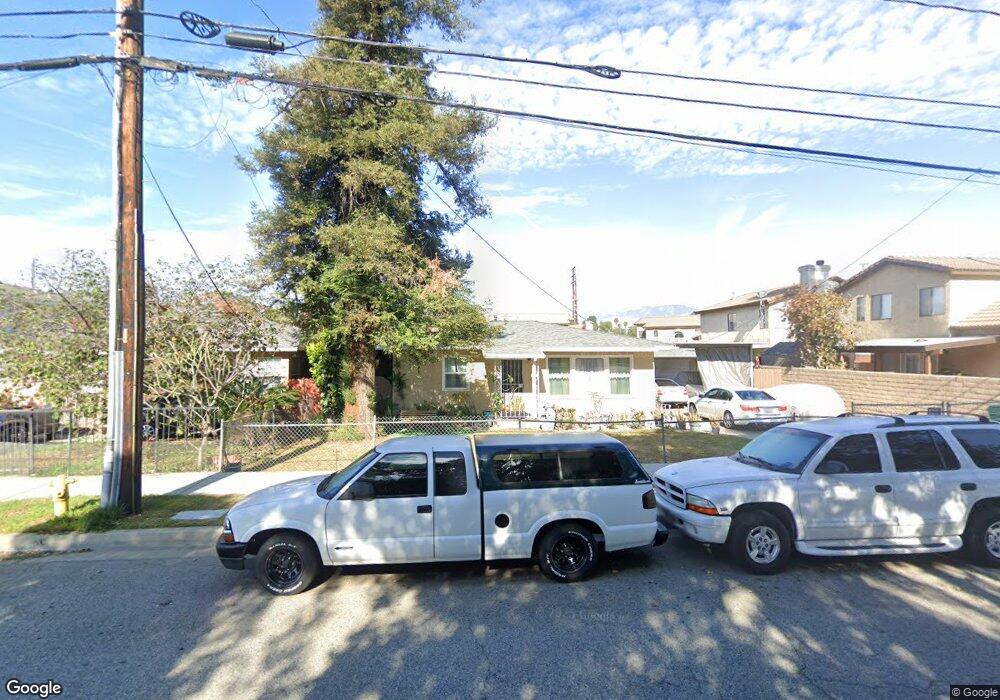
1614 Via Rosa Baldwin Park, CA 91706
Estimated Value: $680,148 - $770,000
3
Beds
3
Baths
1,606
Sq Ft
$441/Sq Ft
Est. Value
About This Home
This home is located at 1614 Via Rosa, Baldwin Park, CA 91706 and is currently estimated at $707,787, approximately $440 per square foot. 1614 Via Rosa is a home located in Los Angeles County with nearby schools including Foster Elementary, Charles D. Jones Junior High School, and Baldwin Park High School.
Ownership History
Date
Name
Owned For
Owner Type
Purchase Details
Closed on
Dec 16, 2014
Sold by
Abila Alfredo and Rubiano Teresita
Bought by
Ko Christina
Current Estimated Value
Purchase Details
Closed on
Aug 6, 1996
Sold by
Federal National Mortgage Association
Bought by
Abila Alfredo and Rubiano Teresita
Home Financials for this Owner
Home Financials are based on the most recent Mortgage that was taken out on this home.
Original Mortgage
$116,400
Interest Rate
8.23%
Mortgage Type
Seller Take Back
Purchase Details
Closed on
Feb 5, 1996
Sold by
Delrosario Bayani and Delrosario Willyna
Bought by
Federal National Mortgage Association
Purchase Details
Closed on
Feb 21, 1995
Sold by
Delrosario Bayani and Delrosario Willyna
Bought by
New England Financial Corp
Purchase Details
Closed on
Jan 27, 1994
Sold by
Delrosario Bayani and Delrosario Willyna
Bought by
Delrosario Bayani and Delrosario Willyna
Create a Home Valuation Report for This Property
The Home Valuation Report is an in-depth analysis detailing your home's value as well as a comparison with similar homes in the area
Home Values in the Area
Average Home Value in this Area
Purchase History
| Date | Buyer | Sale Price | Title Company |
|---|---|---|---|
| Ko Christina | $355,000 | First American Title | |
| Abila Alfredo | $120,000 | Guardian Title Company | |
| Federal National Mortgage Association | $136,000 | Benefit Land Title Ins Co | |
| New England Financial Corp | -- | -- | |
| Delrosario Bayani | -- | United Title Company |
Source: Public Records
Mortgage History
| Date | Status | Borrower | Loan Amount |
|---|---|---|---|
| Previous Owner | Abila Alfredo | $116,400 |
Source: Public Records
Tax History Compared to Growth
Tax History
| Year | Tax Paid | Tax Assessment Tax Assessment Total Assessment is a certain percentage of the fair market value that is determined by local assessors to be the total taxable value of land and additions on the property. | Land | Improvement |
|---|---|---|---|---|
| 2025 | $5,933 | $484,336 | $290,602 | $193,734 |
| 2024 | $5,933 | $474,840 | $284,904 | $189,936 |
| 2023 | $5,871 | $465,530 | $279,318 | $186,212 |
| 2022 | $5,989 | $456,403 | $273,842 | $182,561 |
| 2021 | $5,897 | $447,455 | $268,473 | $178,982 |
| 2019 | $5,520 | $434,185 | $260,511 | $173,674 |
| 2018 | $5,247 | $425,672 | $255,403 | $170,269 |
| 2016 | $4,932 | $409,145 | $245,487 | $163,658 |
| 2015 | $2,305 | $162,603 | $27,094 | $135,509 |
| 2014 | $2,194 | $159,419 | $26,564 | $132,855 |
Source: Public Records
Map
Nearby Homes
- 13974 Francisquito Ave Unit 8
- 3060 Vineland Ave Unit 7
- 1735 Puente Ave Unit 30
- 1416 Millbury Ave
- 1718 Puente Ave Unit 40
- 14104 Barrydale St
- 3314 Baldwin Park Blvd
- 1525 Bromley Ave
- 13655 Foster Ave Unit 2
- 3355 Vineland Ave
- 14360 Merced Ave
- 13522 Francisquito Ave Unit C
- 3004 Via Delores
- 1311 S Leland Ave
- 13438 Francisquito Ave
- 3537 Maine Ave
- 1003 Le Borgne Ave
- 1240 S Bromley Ave
- 3632 Jackson Way
- 915 Stichman Ave
- 1612 Via Rosa
- 1621 Via Rosa
- 1635 Big Dalton Ave
- 1616 Via Rosa
- 1623 Via Rosa
- 1610 Via Rosa
- 1619 Via Rosa
- 1629 Big Dalton Ave
- 1617 Via Rosa
- 1625 Big Dalton Ave
- 1608 Via Rosa
- 1618 Via Rosa
- 1625 Via Rosa
- 1615 Via Rosa
- 1619 Big Dalton Ave
- 1627 Via Rosa
- 1613 Via Rosa
- 1606 Via Rosa
- 1629 Via Rosa
- 1604 Via Rosa