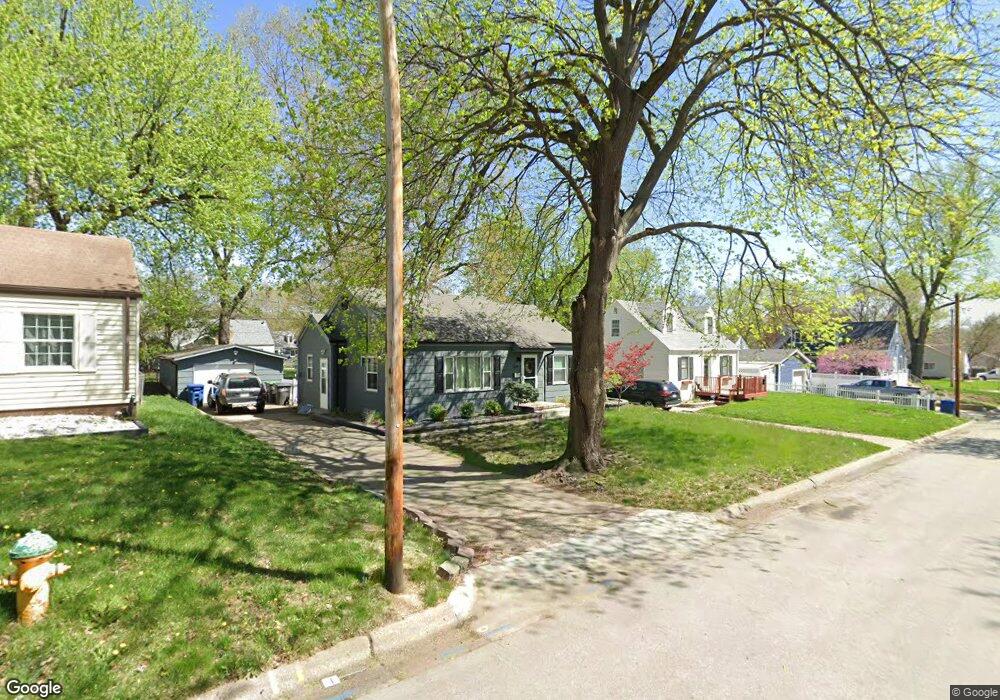
1615 60th St Des Moines, IA 50322
Merle Hay NeighborhoodEstimated Value: $202,701 - $229,000
2
Beds
1
Bath
940
Sq Ft
$228/Sq Ft
Est. Value
About This Home
This home is located at 1615 60th St, Des Moines, IA 50322 and is currently estimated at $214,175, approximately $227 per square foot. 1615 60th St is a home located in Polk County with nearby schools including Windsor Elementary School, Merrill Middle School, and Roosevelt High School.
Ownership History
Date
Name
Owned For
Owner Type
Purchase Details
Closed on
Jul 10, 2025
Sold by
Paulette L Wood Trust and Wood Larrry
Bought by
Larry A Wood Trust and Wood
Current Estimated Value
Purchase Details
Closed on
Oct 19, 2011
Sold by
Stokely Randall and Custer Ashley
Bought by
Wood Larry A and Wood Paulette L
Home Financials for this Owner
Home Financials are based on the most recent Mortgage that was taken out on this home.
Original Mortgage
$94,400
Interest Rate
4.12%
Mortgage Type
New Conventional
Purchase Details
Closed on
May 19, 2008
Sold by
Leclere Bryan E and Leclere Kari L
Bought by
Stokely Randall J and Custer Ashley
Home Financials for this Owner
Home Financials are based on the most recent Mortgage that was taken out on this home.
Original Mortgage
$123,500
Interest Rate
6.5%
Mortgage Type
Purchase Money Mortgage
Purchase Details
Closed on
Nov 4, 1998
Sold by
Adamson Todd A and Adamson Laura J
Bought by
Leclere Bryan E
Home Financials for this Owner
Home Financials are based on the most recent Mortgage that was taken out on this home.
Original Mortgage
$79,509
Interest Rate
6.72%
Mortgage Type
FHA
Create a Home Valuation Report for This Property
The Home Valuation Report is an in-depth analysis detailing your home's value as well as a comparison with similar homes in the area
Home Values in the Area
Average Home Value in this Area
Purchase History
| Date | Buyer | Sale Price | Title Company |
|---|---|---|---|
| Larry A Wood Trust | -- | None Listed On Document | |
| Larry A Wood Trust | -- | None Listed On Document | |
| Wood Larry A | $117,500 | Itc | |
| Stokely Randall J | $123,500 | None Available | |
| Leclere Bryan E | $79,500 | -- |
Source: Public Records
Mortgage History
| Date | Status | Borrower | Loan Amount |
|---|---|---|---|
| Previous Owner | Wood Larry A | $94,400 | |
| Previous Owner | Stokely Randall J | $123,500 | |
| Previous Owner | Leclere Bryan E | $79,509 |
Source: Public Records
Tax History Compared to Growth
Tax History
| Year | Tax Paid | Tax Assessment Tax Assessment Total Assessment is a certain percentage of the fair market value that is determined by local assessors to be the total taxable value of land and additions on the property. | Land | Improvement |
|---|---|---|---|---|
| 2025 | $3,250 | $183,800 | $44,300 | $139,500 |
| 2024 | $3,250 | $165,200 | $39,100 | $126,100 |
| 2023 | $3,394 | $165,200 | $39,100 | $126,100 |
| 2022 | $3,368 | $144,000 | $35,300 | $108,700 |
| 2021 | $3,232 | $144,000 | $35,300 | $108,700 |
| 2020 | $3,358 | $129,500 | $31,400 | $98,100 |
| 2019 | $3,096 | $129,500 | $31,400 | $98,100 |
| 2018 | $3,064 | $115,200 | $27,400 | $87,800 |
| 2017 | $2,770 | $115,200 | $27,400 | $87,800 |
| 2016 | $2,698 | $102,400 | $23,900 | $78,500 |
| 2015 | $2,698 | $102,400 | $23,900 | $78,500 |
| 2014 | $2,366 | $92,400 | $21,200 | $71,200 |
Source: Public Records
Map
Nearby Homes