1615 78th Ave Oakland, CA 94621
Arroyo Viejo NeighborhoodEstimated Value: $461,000 - $560,000
2
Beds
1
Bath
1,248
Sq Ft
$406/Sq Ft
Est. Value
About This Home
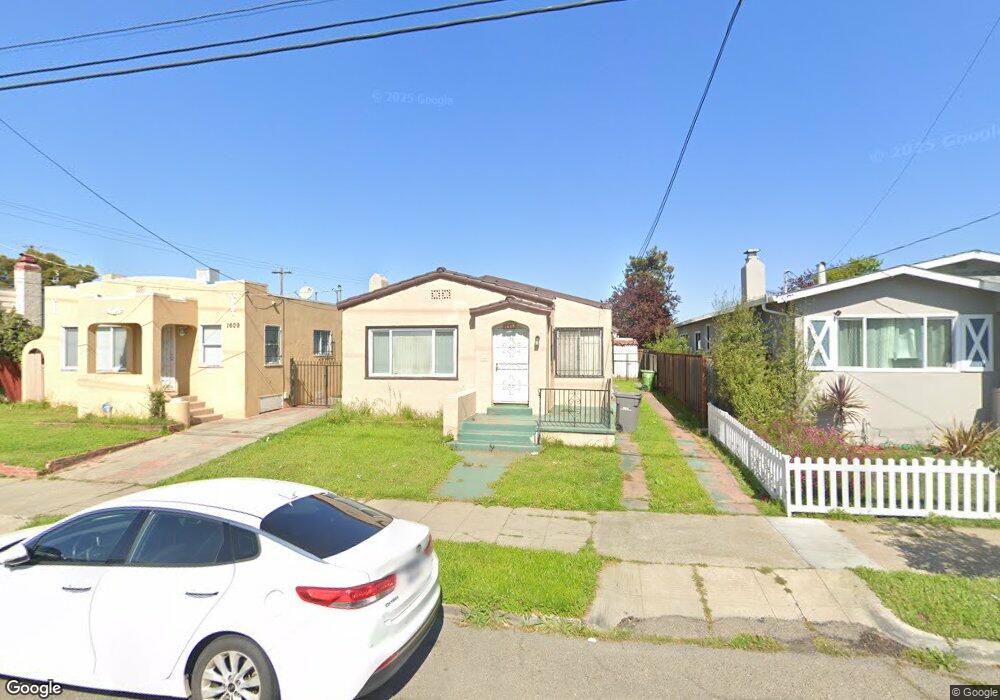
This home is located at 1615 78th Ave, Oakland, CA 94621 and is currently estimated at $507,064, approximately $406 per square foot. 1615 78th Ave is a home located in Alameda County with nearby schools including East Oakland Pride Elementary School, Coliseum College Prep Academy, and Frick United Academy of Language.
Ownership History
Date
Name
Owned For
Owner Type
Purchase Details
Closed on
Jun 27, 2018
Sold by
Perry Jacob
Bought by
Thomas Tenisha
Current Estimated Value
Purchase Details
Closed on
Apr 28, 2011
Sold by
Perry Collia Mae and The Jacob Collia Mae Perry Tru
Bought by
Thomas Tenisha C
Purchase Details
Closed on
May 6, 2010
Sold by
Perry Collia M
Bought by
Thomas Tenisha C
Purchase Details
Closed on
Jan 30, 2004
Sold by
Perry Jacob and Perry Collia Mae
Bought by
Perry Jacob and Perry Collia M
Create a Home Valuation Report for This Property
The Home Valuation Report is an in-depth analysis detailing your home's value as well as a comparison with similar homes in the area
Home Values in the Area
Average Home Value in this Area
Purchase History
| Date | Buyer | Sale Price | Title Company |
|---|---|---|---|
| Thomas Tenisha | -- | None Available | |
| Perry Jacob | -- | None Available | |
| Thomas Tenisha C | $34,443,636 | None Available | |
| Thomas Tenisha C | $34,443,636 | None Available | |
| Perry Jacob | -- | -- |
Source: Public Records
Tax History Compared to Growth
Tax History
| Year | Tax Paid | Tax Assessment Tax Assessment Total Assessment is a certain percentage of the fair market value that is determined by local assessors to be the total taxable value of land and additions on the property. | Land | Improvement |
|---|---|---|---|---|
| 2025 | $2,451 | $48,790 | $22,556 | $26,234 |
| 2024 | $2,451 | $47,833 | $22,114 | $25,719 |
| 2023 | $2,441 | $46,895 | $21,680 | $25,215 |
| 2022 | $2,301 | $45,976 | $21,255 | $24,721 |
| 2021 | $2,035 | $45,074 | $20,838 | $24,236 |
| 2020 | $2,134 | $44,613 | $20,625 | $23,988 |
| 2019 | $6,366 | $375,000 | $112,500 | $262,500 |
| 2018 | $1,702 | $42,880 | $19,824 | $23,056 |
| 2017 | $1,597 | $42,039 | $19,435 | $22,604 |
| 2016 | $1,442 | $41,215 | $19,054 | $22,161 |
| 2015 | $1,910 | $40,596 | $18,768 | $21,828 |
| 2014 | $1,469 | $39,800 | $18,400 | $21,400 |
Source: Public Records
Map
Nearby Homes
- 7807 Weld St
- 7447 Lockwood St
- 7425 Weld St
- 1552 77th Ave
- 7448 Lockwood St
- 7412 Weld St
- 7851 Holly St
- 7608 Arthur St
- 1626 79th Ave
- 1521 80th Ave
- 7231 Lockwood St
- 2326 Maywood Ave
- 1455 76th Ave
- 1440 76th Ave
- 7400 Fresno St
- 8131 Plymouth St
- 5542 International Blvd
- 1811 70th Ave
- 1652 71st Ave
- 7701 Bancroft Ave