


1615 Chase Ave Cincinnati, OH 45223
Northside Neighborhood
1
Bed
1.5
Baths
1,104
Sq Ft
$333/mo
HOA Fee
Highlights
- Eat-In Gourmet Kitchen
- Wood Flooring
- Solid Wood Cabinet
- Walnut Hills High School Rated A+
- Porch
- 4-minute walk to Jacob Hoffner Park
About This Home
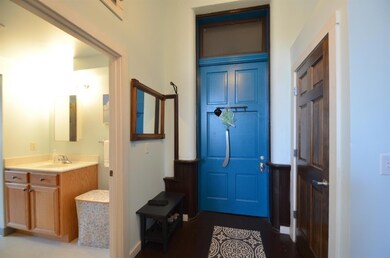
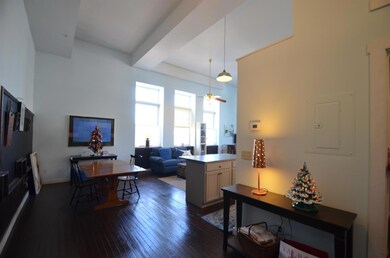
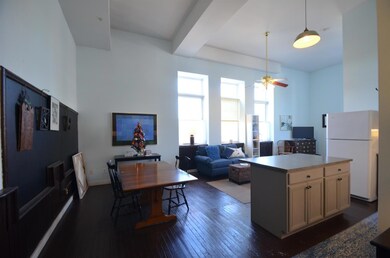
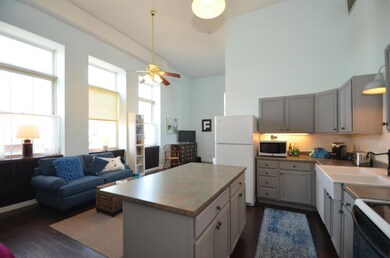
As of April 2025Sold Before Sent. Nicely updated condo in historic Chase Commons. Great 1880 vintage schoolhouse details intact including blackboards! Elevator building. Easy living. Onsite parking. Walk to all of the Northside hotspots! Layout could be 2 BR, but currently 1 BR with lots of open space. In unit laundry.
Last Agent to Sell the Property
Keller Williams Advisors License #2003019570 Listed on: 03/30/2020
Property Details
Home Type
- Condominium
Est. Annual Taxes
- $2,351
Year Built
- Built in 1880
HOA Fees
- $333 Monthly HOA Fees
Home Design
- Brick Exterior Construction
- Stone Foundation
- Shingle Roof
Interior Spaces
- 1,104 Sq Ft Home
- Property has 1 Level
- Woodwork
- Ceiling height of 9 feet or more
- Vinyl Clad Windows
- Insulated Windows
- Double Hung Windows
- Panel Doors
- Wood Flooring
Kitchen
- Eat-In Gourmet Kitchen
- Breakfast Bar
- Oven or Range
- Dishwasher
- Kitchen Island
- Solid Wood Cabinet
- Disposal
Bedrooms and Bathrooms
- 1 Bedroom
Parking
- Driveway
- On-Street Parking
Outdoor Features
- Porch
Utilities
- Forced Air Heating and Cooling System
- Electric Water Heater
Community Details
- Association fees include maintenanceexterior, snowremoval, association dues, exercisefacility, landscapingcommunity, professionalmgt
- L & B Association
Ownership History
Date
Name
Owned For
Owner Type
Purchase Details
Listed on
Feb 14, 2025
Closed on
Apr 29, 2025
Sold by
Diaz Ethan Angelo
Bought by
Hergert David and Hergert Susan
Seller's Agent
Colleen Wright
ERA REAL Solutions Realty. LLC
Buyer's Agent
Colleen Wright
ERA REAL Solutions Realty. LLC
List Price
$179,900
Sold Price
$170,000
Premium/Discount to List
-$9,900
-5.5%
Views
51
Current Estimated Value
Home Financials for this Owner
Home Financials are based on the most recent Mortgage that was taken out on this home.
Estimated Appreciation
-$1,696
Avg. Annual Appreciation
0.51%
Original Mortgage
$127,500
Outstanding Balance
$127,388
Interest Rate
6.67%
Mortgage Type
New Conventional
Estimated Equity
$42,838
Purchase Details
Listed on
May 16, 2023
Closed on
Jul 3, 2023
Sold by
Dunkle Joseph
Bought by
Ethan Angelo Diaz
Seller's Agent
Freda Allen
Comey & Shepherd
Buyer's Agent
Default zSystem
zSystem Default
Sold Price
$1,100
Views
82
Home Financials for this Owner
Home Financials are based on the most recent Mortgage that was taken out on this home.
Avg. Annual Appreciation
1.79%
Interest Rate
6.71%
Purchase Details
Closed on
Jun 23, 2023
Sold by
Dunkle Joseph
Bought by
Diaz Ethan Angelo
Home Financials for this Owner
Home Financials are based on the most recent Mortgage that was taken out on this home.
Interest Rate
6.71%
Purchase Details
Listed on
Jun 24, 2019
Closed on
Jul 31, 2019
Sold by
Amann Meredith
Bought by
Dunkle Joseph
Seller's Agent
Cindy Bruner
Huff Realty
Buyer's Agent
Steven Taylor
eXp Realty
List Price
$115,900
Sold Price
$110,000
Premium/Discount to List
-$5,900
-5.09%
Home Financials for this Owner
Home Financials are based on the most recent Mortgage that was taken out on this home.
Avg. Annual Appreciation
7.54%
Original Mortgage
$106,700
Interest Rate
3.73%
Mortgage Type
New Conventional
Purchase Details
Closed on
Feb 11, 2016
Sold by
Shumakh Alexander
Bought by
Amann Meredith
Home Financials for this Owner
Home Financials are based on the most recent Mortgage that was taken out on this home.
Interest Rate
3.65%
Purchase Details
Closed on
May 6, 2011
Sold by
Charles Mark Duane
Bought by
Shumakh Alexander
Purchase Details
Closed on
Jun 26, 2006
Sold by
The Womens Research & Development Center
Bought by
Charles Mark Duane
Home Financials for this Owner
Home Financials are based on the most recent Mortgage that was taken out on this home.
Original Mortgage
$48,000
Interest Rate
6.72%
Mortgage Type
Purchase Money Mortgage
Purchase Details
Closed on
Dec 29, 1994
Sold by
Beckham Gail M
Bought by
Beckham David Alan
Similar Homes in Cincinnati, OH
-
$160,000
- 2 Beds
- 1 Bath
- 717 Sq Ft
- 2151 Fulton Ave
- Cincinnati, OH
Charming Third-Floor Condo in the Heart of Walnut Hills! Discover urban living with classic character in this bright and spacious 2-bedroom condo located on the top floor of a charming building in Walnut Hills. Enjoy beautiful hardwood floors, tall ceilings, and a layout that offers both comfort and style. Whether you're relaxing at home or hosting guests, this space feels open and inviting.
Cindy Shetterly Keller Williams Distinctive RE
-
$165,000
- 2 Beds
- 1 Bath
- 814 Sq Ft
- 2110 Fulton Ave
- Cincinnati, OH
Well maintained, and a spacious 814 sq ft, 2 bedroom Condo. Conveniently located near Eden Park, Downtown, and I-71 & 1-75. This unit offer hardwood floors, updated carpet and plenty of natural light. The bright and sunny kitchen and counter bar is open to the great room and breakfast area. The owners suite offer 3 closet and next to the full bath. The guest room is spacious and brite. Come with
Bruce Koehler Comey & Shepherd
-
$165,000
- 2 Beds
- 2 Baths
- 1,131 Sq Ft
- 3953 School Section Rd
- Cincinnati, OH
Live the Condo lifestyle in the beautiful Stone Hedge II community! Welcome home to this updated second-floor condo featuring vaulted ceilings, fresh paint, and modern flooring. The spacious primary bedroom offers a full en-suite bathroom and a walk-in closet. The updated bathrooms and in-unit laundry add everyday convenience. Enjoy extra storage space on the private deck, plus an included garage
Angel Wiggins Comey & Shepherd
-
$179,900
- 2 Beds
- 2 Baths
- 1,159 Sq Ft
- 9830 Regatta Dr
- Cincinnati, OH
Gorgeous Lower Level condo in desirable Yacht Club. This end unit condo allows you to walk around and enter through the patio door to avoid any steps! You will love the private green space and open floor plan! The inside features a beautiful Kitchen with Granite counters, backsplash, and newer appliances (2018), 2 large bedrooms, 2 updated full bathrooms, and custom blinds. Breathe easy knowing
Jillian Sprague Plum Tree Realty
-
$183,000
- 2 Beds
- 1.5 Baths
- 968 Sq Ft
- 522 Riddle Rd
- Cincinnati, OH
Welcome to your new homeor next great investmentjust 2 blocks from the University of Cincinnati! This bright and well-maintained 2-bedroom, 1.5-bathroom condo is perfect for your personal residence or for investors. Enjoy the convenience of in-unit laundry and 2 assigned parking spots. The main living room features a cathedral ceiling with a sliding glass door with a private balcony overlooking
Jonathan Minerick homecoin.com
-
$139,000
- 2 Beds
- 2 Baths
- 1,014 Sq Ft
- 2680 Lehman Rd
- Cincinnati, OH
Beautiful views of the city right from the comfort on your private balcony! This condo is located on the third floor; however, no steps required as the building does have a ground floor elevator. HOA fees for this unit includes an assigned covered parking spot. Currently being used as a rental property making it a great addition to any portfolio!
Paige Bond Realty First
-
$129,900
- 2 Beds
- 1 Bath
- 1,014 Sq Ft
- 2680 Lehman Rd
- Cincinnati, OH
See the pictures, great investment property. Perfect inside and out and well managed complex. Spectacular views of Cincinnati, Northern Kentucky and the Ohio River. The condo has everything upgraded in the kitchen all appliances stay. 2 bedrooms, 1 bath, all new everything. Just reduced 13,000. Deeded separate storage room that other units do not have. Owner motivated to sell.
Bill Whitaker Huff Realty
Create a Home Valuation Report for This Property
The Home Valuation Report is an in-depth analysis detailing your home's value as well as a comparison with similar homes in the area
Home Values in the Area
Average Home Value in this Area
Purchase History
| Date | Type | Sale Price | Title Company |
|---|---|---|---|
| Warranty Deed | $170,000 | None Listed On Document | |
| Warranty Deed | $170,000 | None Listed On Document | |
| Deed | $152,000 | -- | |
| Warranty Deed | $152,000 | Chicago Title Company | |
| Warranty Deed | $110,000 | None Available | |
| Deed | $70,000 | -- | |
| Legal Action Court Order | $16,500 | None Available | |
| Warranty Deed | $55,000 | Cambridge Land Title Agency | |
| Quit Claim Deed | -- | -- |
Source: Public Records
Mortgage History
| Date | Status | Loan Amount | Loan Type |
|---|---|---|---|
| Open | $127,500 | New Conventional | |
| Closed | $127,500 | New Conventional | |
| Previous Owner | -- | No Value Available | |
| Previous Owner | $121,600 | Credit Line Revolving | |
| Previous Owner | $106,700 | New Conventional | |
| Previous Owner | -- | No Value Available | |
| Previous Owner | $46,700 | Future Advance Clause Open End Mortgage | |
| Previous Owner | $48,000 | Purchase Money Mortgage |
Source: Public Records
Property History
| Date | Event | Price | Change | Sq Ft Price |
|---|---|---|---|---|
| 04/29/2025 04/29/25 | Sold | $170,000 | -5.5% | $211 / Sq Ft |
| 04/06/2025 04/06/25 | Off Market | $179,900 | -- | -- |
| 03/30/2025 03/30/25 | Pending | -- | -- | -- |
| 03/11/2025 03/11/25 | For Sale | $179,900 | -16.3% | $223 / Sq Ft |
| 02/21/2025 02/21/25 | Sold | $215,000 | +19.5% | $133 / Sq Ft |
| 02/19/2025 02/19/25 | Off Market | $179,900 | -- | -- |
| 02/14/2025 02/14/25 | For Sale | $179,900 | -16.3% | $223 / Sq Ft |
| 01/30/2025 01/30/25 | Pending | -- | -- | -- |
| 01/25/2025 01/25/25 | For Sale | $215,000 | +72.0% | $133 / Sq Ft |
| 01/23/2025 01/23/25 | Sold | $125,000 | -3.1% | $260 / Sq Ft |
| 12/31/2024 12/31/24 | Pending | -- | -- | -- |
| 11/07/2024 11/07/24 | For Sale | $129,000 | -21.8% | $269 / Sq Ft |
| 06/14/2024 06/14/24 | Sold | $165,000 | +6.5% | $176 / Sq Ft |
| 05/29/2024 05/29/24 | Sold | $155,000 | -18.0% | $144 / Sq Ft |
| 05/24/2024 05/24/24 | Sold | $189,000 | +65.8% | $197 / Sq Ft |
| 05/10/2024 05/10/24 | Sold | $114,000 | -30.9% | $234 / Sq Ft |
| 05/10/2024 05/10/24 | Pending | -- | -- | -- |
| 05/09/2024 05/09/24 | For Sale | $164,900 | -10.9% | $175 / Sq Ft |
| 04/24/2024 04/24/24 | Pending | -- | -- | -- |
| 04/22/2024 04/22/24 | For Sale | $185,000 | +16.4% | $193 / Sq Ft |
| 04/06/2024 04/06/24 | Pending | -- | -- | -- |
| 03/29/2024 03/29/24 | Pending | -- | -- | -- |
| 03/01/2024 03/01/24 | Price Changed | $159,000 | -3.0% | $148 / Sq Ft |
| 02/20/2024 02/20/24 | For Sale | $164,000 | +36.8% | $152 / Sq Ft |
| 02/08/2024 02/08/24 | For Sale | $119,900 | 0.0% | $246 / Sq Ft |
| 01/28/2024 01/28/24 | Off Market | $1,100 | -- | -- |
| 08/28/2023 08/28/23 | Rented | $1,100 | 0.0% | -- |
| 08/24/2023 08/24/23 | Sold | $165,000 | +0.1% | $172 / Sq Ft |
| 07/25/2023 07/25/23 | Pending | -- | -- | -- |
| 07/25/2023 07/25/23 | For Sale | $164,900 | 0.0% | $172 / Sq Ft |
| 06/26/2023 06/26/23 | Under Contract | -- | -- | -- |
| 05/16/2023 05/16/23 | For Rent | $1,100 | 0.0% | -- |
| 10/19/2021 10/19/21 | Off Market | $163,000 | -- | -- |
| 12/18/2020 12/18/20 | Sold | $163,000 | -1.2% | $170 / Sq Ft |
| 11/11/2020 11/11/20 | Pending | -- | -- | -- |
| 10/30/2020 10/30/20 | For Sale | $165,000 | +60.2% | $172 / Sq Ft |
| 09/22/2020 09/22/20 | Off Market | $103,000 | -- | -- |
| 09/16/2020 09/16/20 | Off Market | $154,000 | -- | -- |
| 07/09/2020 07/09/20 | Off Market | $149,900 | -- | -- |
| 06/22/2020 06/22/20 | Sold | $103,000 | -33.1% | $109 / Sq Ft |
| 06/16/2020 06/16/20 | Sold | $154,000 | -3.1% | $95 / Sq Ft |
| 05/13/2020 05/13/20 | Pending | -- | -- | -- |
| 05/08/2020 05/08/20 | For Sale | $159,000 | +44.5% | $99 / Sq Ft |
| 05/08/2020 05/08/20 | Pending | -- | -- | -- |
| 05/01/2020 05/01/20 | For Sale | $110,000 | -26.6% | $117 / Sq Ft |
| 04/09/2020 04/09/20 | Sold | $149,900 | 0.0% | $136 / Sq Ft |
| 03/30/2020 03/30/20 | Pending | -- | -- | -- |
| 03/30/2020 03/30/20 | For Sale | $149,900 | +36.3% | $136 / Sq Ft |
| 10/30/2019 10/30/19 | Off Market | $110,000 | -- | -- |
| 07/31/2019 07/31/19 | Sold | $110,000 | 0.0% | $136 / Sq Ft |
| 07/11/2019 07/11/19 | Pending | -- | -- | -- |
| 07/02/2019 07/02/19 | Price Changed | $110,000 | -5.1% | $136 / Sq Ft |
| 06/24/2019 06/24/19 | For Sale | $115,900 | -7.6% | $144 / Sq Ft |
| 02/11/2019 02/11/19 | Off Market | $125,500 | -- | -- |
| 11/13/2018 11/13/18 | Sold | $125,500 | -3.5% | $134 / Sq Ft |
| 10/01/2018 10/01/18 | Pending | -- | -- | -- |
| 09/19/2018 09/19/18 | For Sale | $130,000 | +40.5% | $138 / Sq Ft |
| 07/12/2018 07/12/18 | Off Market | $92,500 | -- | -- |
| 04/11/2018 04/11/18 | Sold | $92,500 | -31.2% | $198 / Sq Ft |
| 03/15/2018 03/15/18 | Off Market | $134,450 | -- | -- |
| 03/11/2018 03/11/18 | Pending | -- | -- | -- |
| 02/22/2018 02/22/18 | For Sale | $92,500 | +5.1% | $198 / Sq Ft |
| 02/07/2018 02/07/18 | Off Market | $88,000 | -- | -- |
| 12/15/2017 12/15/17 | Sold | $134,450 | +52.8% | $122 / Sq Ft |
| 11/09/2017 11/09/17 | Sold | $88,000 | -11.9% | $110 / Sq Ft |
| 10/30/2017 10/30/17 | Pending | -- | -- | -- |
| 10/27/2017 10/27/17 | For Sale | $99,900 | -25.7% | $125 / Sq Ft |
| 10/06/2017 10/06/17 | Pending | -- | -- | -- |
| 09/12/2017 09/12/17 | Off Market | $134,450 | -- | -- |
| 09/11/2017 09/11/17 | For Sale | $134,900 | 0.0% | $122 / Sq Ft |
| 08/21/2017 08/21/17 | Pending | -- | -- | -- |
| 08/15/2017 08/15/17 | For Sale | $134,900 | +7.9% | $122 / Sq Ft |
| 07/26/2017 07/26/17 | Off Market | $125,000 | -- | -- |
| 05/22/2017 05/22/17 | Off Market | $74,000 | -- | -- |
| 05/02/2017 05/02/17 | Off Market | $135,000 | -- | -- |
| 04/26/2017 04/26/17 | Sold | $125,000 | 0.0% | $113 / Sq Ft |
| 03/08/2017 03/08/17 | Pending | -- | -- | -- |
| 03/04/2017 03/04/17 | For Sale | $125,000 | +68.9% | $113 / Sq Ft |
| 02/21/2017 02/21/17 | Sold | $74,000 | -45.2% | $93 / Sq Ft |
| 02/01/2017 02/01/17 | Sold | $135,000 | +82.4% | $122 / Sq Ft |
| 01/23/2017 01/23/17 | Pending | -- | -- | -- |
| 01/05/2017 01/05/17 | For Sale | $74,000 | +18.4% | $93 / Sq Ft |
| 12/07/2016 12/07/16 | Off Market | $62,500 | -- | -- |
| 11/24/2016 11/24/16 | Pending | -- | -- | -- |
| 11/18/2016 11/18/16 | Price Changed | $139,900 | -6.7% | $127 / Sq Ft |
| 10/04/2016 10/04/16 | For Sale | $149,900 | +139.8% | $136 / Sq Ft |
| 09/07/2016 09/07/16 | Sold | $62,500 | 0.0% | $130 / Sq Ft |
| 08/10/2016 08/10/16 | Pending | -- | -- | -- |
| 07/29/2016 07/29/16 | For Sale | $62,500 | -16.7% | $130 / Sq Ft |
| 02/01/2016 02/01/16 | Off Market | $75,000 | -- | -- |
| 11/03/2015 11/03/15 | Sold | $75,000 | -9.6% | $94 / Sq Ft |
| 09/08/2015 09/08/15 | Pending | -- | -- | -- |
| 07/14/2015 07/14/15 | For Sale | $83,000 | -17.0% | $104 / Sq Ft |
| 01/25/2015 01/25/15 | Off Market | $100,000 | -- | -- |
| 12/10/2014 12/10/14 | Off Market | $50,000 | -- | -- |
| 10/24/2014 10/24/14 | Sold | $100,000 | +100.0% | $91 / Sq Ft |
| 09/17/2014 09/17/14 | Pending | -- | -- | -- |
| 09/11/2014 09/11/14 | Sold | $50,000 | -56.5% | $107 / Sq Ft |
| 09/05/2014 09/05/14 | For Sale | $115,000 | +130.0% | $104 / Sq Ft |
| 08/28/2014 08/28/14 | Pending | -- | -- | -- |
| 07/08/2014 07/08/14 | For Sale | $50,000 | +100.0% | $107 / Sq Ft |
| 09/11/2012 09/11/12 | Off Market | $25,000 | -- | -- |
| 09/11/2012 09/11/12 | Off Market | $50,000 | -- | -- |
| 06/25/2012 06/25/12 | Off Market | $31,607 | -- | -- |
| 06/13/2012 06/13/12 | Sold | $50,000 | +100.0% | $52 / Sq Ft |
| 06/11/2012 06/11/12 | Sold | $25,000 | -16.7% | $53 / Sq Ft |
| 06/01/2012 06/01/12 | Pending | -- | -- | -- |
| 05/24/2012 05/24/12 | For Sale | $30,000 | -5.1% | $64 / Sq Ft |
| 05/02/2012 05/02/12 | Pending | -- | -- | -- |
| 03/27/2012 03/27/12 | Sold | $31,607 | -46.4% | $29 / Sq Ft |
| 02/29/2012 02/29/12 | For Sale | $59,000 | +86.7% | $62 / Sq Ft |
| 01/21/2012 01/21/12 | Pending | -- | -- | -- |
| 12/20/2011 12/20/11 | For Sale | $31,607 | -- | $29 / Sq Ft |
Source: MLS of Greater Cincinnati (CincyMLS)
Tax History Compared to Growth
Tax History
| Year | Tax Paid | Tax Assessment Tax Assessment Total Assessment is a certain percentage of the fair market value that is determined by local assessors to be the total taxable value of land and additions on the property. | Land | Improvement |
|---|---|---|---|---|
| 2024 | $2,351 | $39,368 | $7,875 | $31,493 |
| 2023 | $2,404 | $39,368 | $7,875 | $31,493 |
| 2022 | $2,620 | $38,500 | $1,687 | $36,813 |
| 2021 | $2,522 | $38,500 | $1,687 | $36,813 |
| 2020 | $2,596 | $38,500 | $1,687 | $36,813 |
| 2019 | $1,872 | $24,500 | $1,575 | $22,925 |
| 2018 | $1,873 | $24,500 | $1,575 | $22,925 |
| 2017 | $1,804 | $24,500 | $1,575 | $22,925 |
| 2016 | $1,040 | $14,581 | $1,596 | $12,985 |
| 2015 | $937 | $14,581 | $1,596 | $12,985 |
| 2014 | $190 | $14,581 | $1,596 | $12,985 |
| 2013 | $252 | $19,184 | $2,100 | $17,084 |
Source: Public Records
Agents Affiliated with this Home
-
Seller's Agent in 2025
Alek Lucke
Coldwell Banker Realty
(419) 236-9151
3 in this area
44 Total Sales
-
C
Seller's Agent in 2025
Colleen Wright
ERA REAL Solutions Realty. LLC
(513) 375-1022
2 in this area
32 Total Sales
-
Seller's Agent in 2025
Robert DiTomassi
Comey & Shepherd
(513) 255-5154
20 in this area
202 Total Sales
-
B
Seller Co-Listing Agent in 2025
Barbra Druffel
Comey & Shepherd
(513) 403-3454
14 in this area
138 Total Sales
-
I
Buyer's Agent in 2025
Ioanna Paraskevopoulos
Keller Williams Advisors
-
Buyer's Agent in 2025
Dean Frank
Coldwell Banker Realty
(513) 827-5011
3 in this area
42 Total Sales
Map
Source: MLS of Greater Cincinnati (CincyMLS)
MLS Number: 1656438
APN: 196-0025-0157
Disclaimer: Certain information contained herein is derived from information provided by parties other than Homes.com. All information provided is deemed reliable, but is not guaranteed to be accurate and should be independently verified.
![]() The data relating to real estate for sale on this website comes in part from the Broker Reciprocity programs of the MLS of Greater Cincinnati, Inc.. Those listings held by brokerage firms other than Ten-X are marked with the Broker Reciprocity logo and house icon. The properties displayed may not be all of the properties available through Broker Reciprocity.
The data relating to real estate for sale on this website comes in part from the Broker Reciprocity programs of the MLS of Greater Cincinnati, Inc.. Those listings held by brokerage firms other than Ten-X are marked with the Broker Reciprocity logo and house icon. The properties displayed may not be all of the properties available through Broker Reciprocity.
IDX information is provided exclusively for personal, non-commercial use, and may not be used for any purpose other than to identify prospective properties consumers may be interested in purchasing.
Information is deemed reliable but not guaranteed.
Ten-X does not display the entire Cincinnati MLS Broker Reciprocity™ database on this web site. The listings of some real estate brokerage firms have been excluded.
Copyright 2025, MLS of Greater Cincinnati, Inc. All rights reserved
Nearby Homes
- 4215 Turrill St
- 4216 Delaney St
- 4244 Hamilton Ave
- 1641 Pullan Ave
- 4120 Langland St
- 1527 Lingo St
- 4319 Hamilton Ave
- 1535 Pullan Ave
- 4031 Delaney St
- 4228 Fergus St
- 4230 Fergus St
- 1419 Chase Ave
- 1754 Jester St
- 1756 Hanfield St
- 4034 Colerain Ave
- 4348 Haight Ave
- 1663 Bruce Ave
- 4226 Mad Anthony St
- 4218 Kirby Ave
- 1610 Cooper St