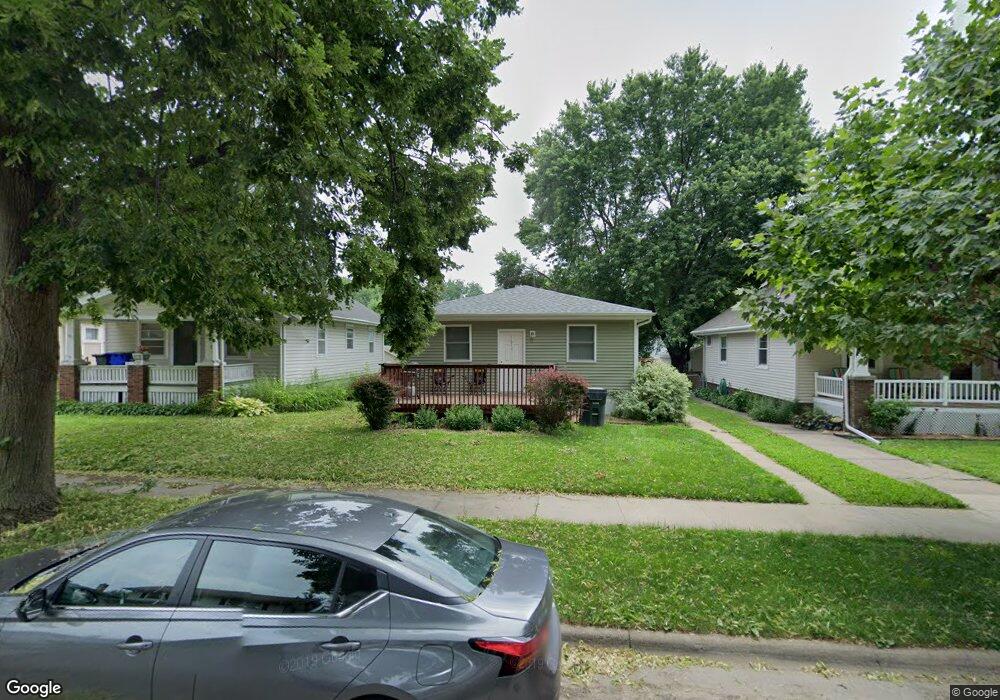
1615 J Ave NE Cedar Rapids, IA 52402
Mound View NeighborhoodEstimated Value: $174,000 - $187,000
4
Beds
2
Baths
1,428
Sq Ft
$128/Sq Ft
Est. Value
About This Home
This home is located at 1615 J Ave NE, Cedar Rapids, IA 52402 and is currently estimated at $182,119, approximately $127 per square foot. 1615 J Ave NE is a home located in Linn County with nearby schools including Garfield Elementary School, Franklin Middle School, and George Washington High School.
Ownership History
Date
Name
Owned For
Owner Type
Purchase Details
Closed on
Nov 25, 2024
Sold by
Appleby Mackenzie Rose and Appleby Kenjamin Cletus
Bought by
Campbell Daquay Shaquan
Current Estimated Value
Home Financials for this Owner
Home Financials are based on the most recent Mortgage that was taken out on this home.
Original Mortgage
$171,830
Outstanding Balance
$169,661
Interest Rate
6.32%
Mortgage Type
FHA
Estimated Equity
$12,458
Purchase Details
Closed on
Aug 13, 2018
Sold by
Mcnamara Bernard J and Mcnamara Shirley J
Bought by
Appleby Mackenzie R and Appleby Reegan
Home Financials for this Owner
Home Financials are based on the most recent Mortgage that was taken out on this home.
Original Mortgage
$96,475
Interest Rate
3.87%
Mortgage Type
Adjustable Rate Mortgage/ARM
Purchase Details
Closed on
Sep 20, 2000
Sold by
Firstar Bank Na
Bought by
Mcnamara Shirley J
Home Financials for this Owner
Home Financials are based on the most recent Mortgage that was taken out on this home.
Original Mortgage
$89,205
Interest Rate
7.9%
Create a Home Valuation Report for This Property
The Home Valuation Report is an in-depth analysis detailing your home's value as well as a comparison with similar homes in the area
Home Values in the Area
Average Home Value in this Area
Purchase History
| Date | Buyer | Sale Price | Title Company |
|---|---|---|---|
| Campbell Daquay Shaquan | $175,000 | None Listed On Document | |
| Campbell Daquay Shaquan | $175,000 | None Listed On Document | |
| Appleby Mackenzie R | $113,500 | None Available | |
| Mcnamara Shirley J | $93,500 | -- |
Source: Public Records
Mortgage History
| Date | Status | Borrower | Loan Amount |
|---|---|---|---|
| Open | Campbell Daquay Shaquan | $171,830 | |
| Closed | Campbell Daquay Shaquan | $171,830 | |
| Previous Owner | Appleby Mackenzie R | $96,475 | |
| Previous Owner | Mcnamara Shirley J | $89,205 |
Source: Public Records
Tax History Compared to Growth
Tax History
| Year | Tax Paid | Tax Assessment Tax Assessment Total Assessment is a certain percentage of the fair market value that is determined by local assessors to be the total taxable value of land and additions on the property. | Land | Improvement |
|---|---|---|---|---|
| 2025 | $2,550 | $175,800 | $26,300 | $149,500 |
| 2024 | $2,550 | $154,600 | $24,200 | $130,400 |
| 2023 | $2,550 | $154,600 | $24,200 | $130,400 |
| 2022 | $2,286 | $129,800 | $24,200 | $105,600 |
| 2021 | $2,266 | $119,300 | $22,200 | $97,100 |
| 2020 | $2,266 | $111,300 | $17,200 | $94,100 |
| 2019 | $2,148 | $108,200 | $17,200 | $91,000 |
| 2018 | $2,086 | $108,200 | $17,200 | $91,000 |
| 2017 | $1,896 | $95,600 | $17,200 | $78,400 |
| 2016 | $2,109 | $99,200 | $17,200 | $82,000 |
| 2015 | $2,101 | $98,722 | $17,170 | $81,552 |
| 2014 | $1,916 | $104,282 | $17,170 | $87,112 |
| 2013 | $1,986 | $104,282 | $17,170 | $87,112 |
Source: Public Records
Map
Nearby Homes
- 1060 17th St NE
- 1204 Elmhurst Dr NE
- 910 Maplewood Dr NE
- 1839 K Ave NE
- 1311 I Ave NE
- 1815 E Ave NE
- 517 18th St NE
- 1857 E Ave NE
- 1046 12th St NE
- 832 Daniels St NE
- 826 Daniels St NE
- 420 16th St NE
- 1735 C Ave NE
- 1719 C Ave NE
- 1115 27th St NE
- 1746 B Ave NE
- 1551 C Ave NE
- 1608 B Ave NE
- 2019 G Ave NE
- 1047 27th St NE
- 1621 J Ave NE
- 1611 J Ave NE
- 1623 J Ave NE
- 1609 J Ave NE
- 1625 J Ave NE
- 1054 16th St NE
- 1603 J Ave NE
- 1042 16th St NE
- 1608 Greene Ave NE
- 1606 Greene Ave NE
- 1622 Greene Ave NE
- 1614 J Ave NE
- 1618 J Ave NE
- 1608 J Ave NE
- 1624 Greene Ave NE
- 1624 J Ave NE
- 1038 16th St NE
- 1602 J Ave NE
- 1061 17th St NE
- 1059 17th St NE