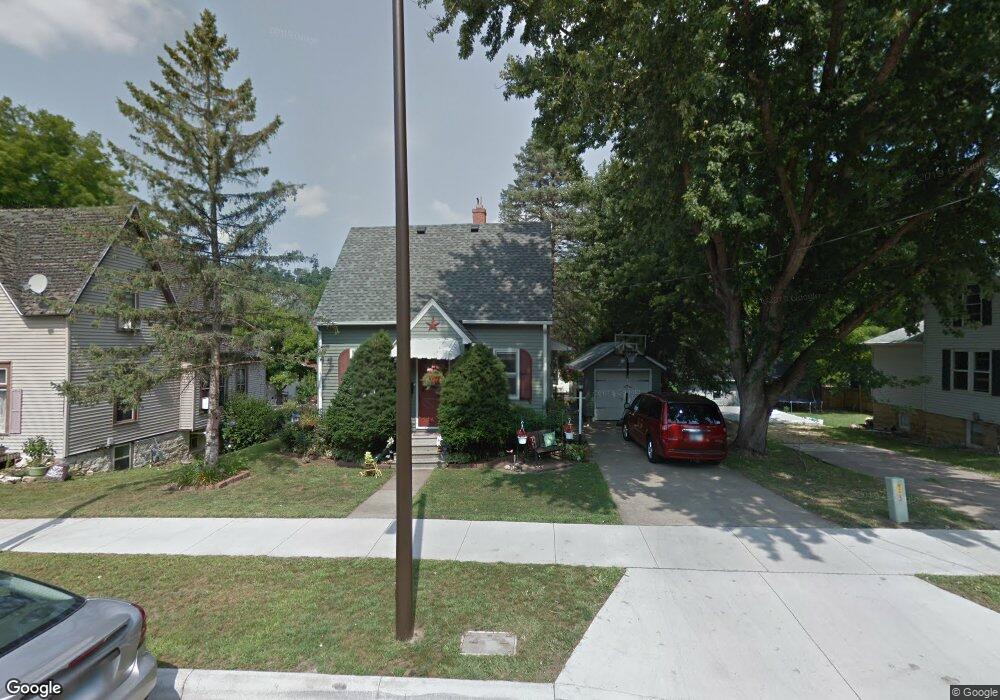
1615 S Park St Red Wing, MN 55066
Estimated Value: $206,000 - $249,000
3
Beds
2
Baths
1,036
Sq Ft
$217/Sq Ft
Est. Value
About This Home
This home is located at 1615 S Park St, Red Wing, MN 55066 and is currently estimated at $224,303, approximately $216 per square foot. 1615 S Park St is a home located in Goodhue County with nearby schools including Sunnyside Elementary School, Burnside Elementary School, and Twin Bluff Middle School.
Ownership History
Date
Name
Owned For
Owner Type
Purchase Details
Closed on
May 28, 2004
Sold by
Guida Daniel P and Guida Sandra L
Bought by
Quiboloy Adino and Quiboloy Lacy
Current Estimated Value
Purchase Details
Closed on
Oct 29, 2003
Sold by
Doty Lois
Bought by
Guida Daniel and Guida Sandra
Purchase Details
Closed on
Jun 27, 2002
Sold by
Department Ot Veterans Affairs Regional
Bought by
Deutsche Bk Natl Trust Co and Countrywide Home Loans
Purchase Details
Closed on
Mar 29, 2002
Sold by
Doty David D
Bought by
Korstad Kimberly K
Purchase Details
Closed on
Jan 23, 2002
Sold by
Va Regional Loan Center
Bought by
Doty David D
Purchase Details
Closed on
Mar 28, 1997
Sold by
Rehder Jeffrey M
Bought by
Benson Steven G and Benson Polly A
Create a Home Valuation Report for This Property
The Home Valuation Report is an in-depth analysis detailing your home's value as well as a comparison with similar homes in the area
Home Values in the Area
Average Home Value in this Area
Purchase History
| Date | Buyer | Sale Price | Title Company |
|---|---|---|---|
| Quiboloy Adino | $133,000 | -- | |
| Guida Daniel | $100,000 | -- | |
| Deutsche Bk Natl Trust Co | $74,414 | -- | |
| Korstad Kimberly K | $99,900 | -- | |
| Doty David D | $83,000 | -- | |
| Benson Steven G | $79,900 | -- |
Source: Public Records
Mortgage History
| Date | Status | Borrower | Loan Amount |
|---|---|---|---|
| Closed | Doty David D | -- |
Source: Public Records
Tax History Compared to Growth
Tax History
| Year | Tax Paid | Tax Assessment Tax Assessment Total Assessment is a certain percentage of the fair market value that is determined by local assessors to be the total taxable value of land and additions on the property. | Land | Improvement |
|---|---|---|---|---|
| 2025 | $2,948 | $197,800 | $37,900 | $159,900 |
| 2024 | $2,948 | $194,700 | $37,900 | $156,800 |
| 2023 | $1,501 | $183,400 | $37,900 | $145,500 |
| 2022 | $2,804 | $182,300 | $37,900 | $144,400 |
| 2021 | $2,694 | $156,900 | $37,900 | $119,000 |
| 2020 | $2,742 | $149,300 | $37,900 | $111,400 |
| 2019 | $2,762 | $141,800 | $37,900 | $103,900 |
| 2018 | $2,646 | $142,300 | $36,400 | $105,900 |
| 2017 | $1,396 | $125,400 | $36,400 | $89,000 |
| 2016 | $1,290 | $119,200 | $36,400 | $82,800 |
| 2015 | $1,236 | $116,400 | $36,400 | $80,000 |
| 2014 | -- | $112,000 | $36,400 | $75,600 |
Source: Public Records
Map
Nearby Homes