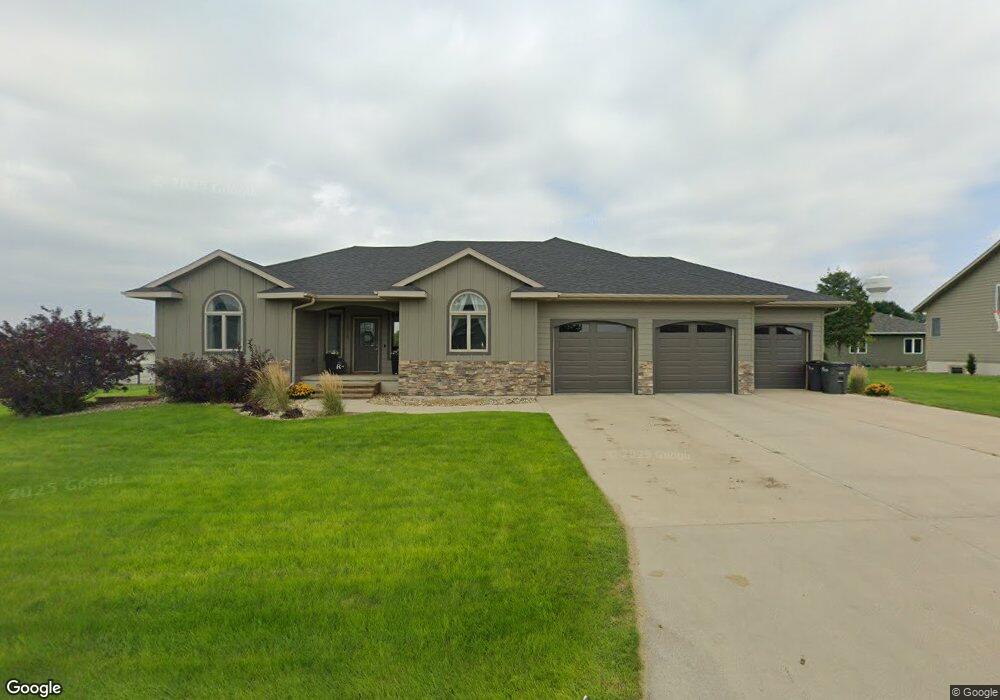
1615 Valley View Place Rock Valley, IA 51247
Estimated Value: $356,000 - $468,000
--
Bed
2
Baths
1,929
Sq Ft
$222/Sq Ft
Est. Value
About This Home
This home is located at 1615 Valley View Place, Rock Valley, IA 51247 and is currently estimated at $428,737, approximately $222 per square foot. 1615 Valley View Place is a home located in Sioux County with nearby schools including Rock Valley Elementary School, Rock Valley Middle School, and Rock Valley Junior/Senior High School.
Ownership History
Date
Name
Owned For
Owner Type
Purchase Details
Closed on
Sep 2, 2016
Sold by
Ranschau Neil J
Bought by
Ranschau Ryan L
Current Estimated Value
Purchase Details
Closed on
Jan 6, 2012
Sold by
Feenstra Corwin and Feenstra Joni M
Bought by
Ranschau Neil J
Home Financials for this Owner
Home Financials are based on the most recent Mortgage that was taken out on this home.
Original Mortgage
$212,320
Outstanding Balance
$22,913
Interest Rate
3.98%
Mortgage Type
New Conventional
Estimated Equity
$405,824
Purchase Details
Closed on
Jun 2, 2008
Sold by
Hoogendoorn Construction
Bought by
Feenstra Corwin and Feenstra Joni M
Home Financials for this Owner
Home Financials are based on the most recent Mortgage that was taken out on this home.
Original Mortgage
$160,000
Interest Rate
6.09%
Mortgage Type
Construction
Create a Home Valuation Report for This Property
The Home Valuation Report is an in-depth analysis detailing your home's value as well as a comparison with similar homes in the area
Home Values in the Area
Average Home Value in this Area
Purchase History
| Date | Buyer | Sale Price | Title Company |
|---|---|---|---|
| Ranschau Ryan L | -- | None Available | |
| Ranschau Neil J | $265,500 | None Available | |
| Feenstra Corwin | $22,500 | None Available |
Source: Public Records
Mortgage History
| Date | Status | Borrower | Loan Amount |
|---|---|---|---|
| Open | Ranschau Neil J | $212,320 | |
| Previous Owner | Feenstra Corwin | $160,000 |
Source: Public Records
Tax History Compared to Growth
Tax History
| Year | Tax Paid | Tax Assessment Tax Assessment Total Assessment is a certain percentage of the fair market value that is determined by local assessors to be the total taxable value of land and additions on the property. | Land | Improvement |
|---|---|---|---|---|
| 2025 | $7,176 | $504,100 | $39,740 | $464,360 |
| 2024 | $7,176 | $432,740 | $39,740 | $393,000 |
| 2023 | $7,020 | $432,740 | $39,740 | $393,000 |
| 2022 | $6,050 | $363,750 | $39,740 | $324,010 |
| 2021 | $6,408 | $361,420 | $39,740 | $321,680 |
| 2020 | $6,408 | $343,020 | $39,740 | $303,280 |
| 2019 | $6,120 | $319,800 | $26,500 | $293,300 |
| 2018 | $6,000 | $319,800 | $26,500 | $293,300 |
| 2017 | $6,000 | $319,800 | $26,500 | $293,300 |
| 2014 | $4,898 | $267,460 | $0 | $0 |
Source: Public Records
Map
Nearby Homes
- 1611 Valley View Place
- 1623 Valley View Place
- 1626 Valley View Rd
- 1620 Valley View Place
- 1607 Valley View Place
- 1624 Valley View Place
- 1616 Valley View Place
- 1628 Valley View Place
- 1614 Valley View Place
- 1602 Valley View Place
- 1606 Valley View Place
- 1629 Valley View Rd
- 1804 Valley View Place
- 1603 Valley View Rd
- 1806 Valley View Rd
- 1622 Southern Hills Dr
- 1804 Southern Hills Dr
- 1805 Valley View Rd
- 1614 Southern Hills Dr
- 1806 5th St SE