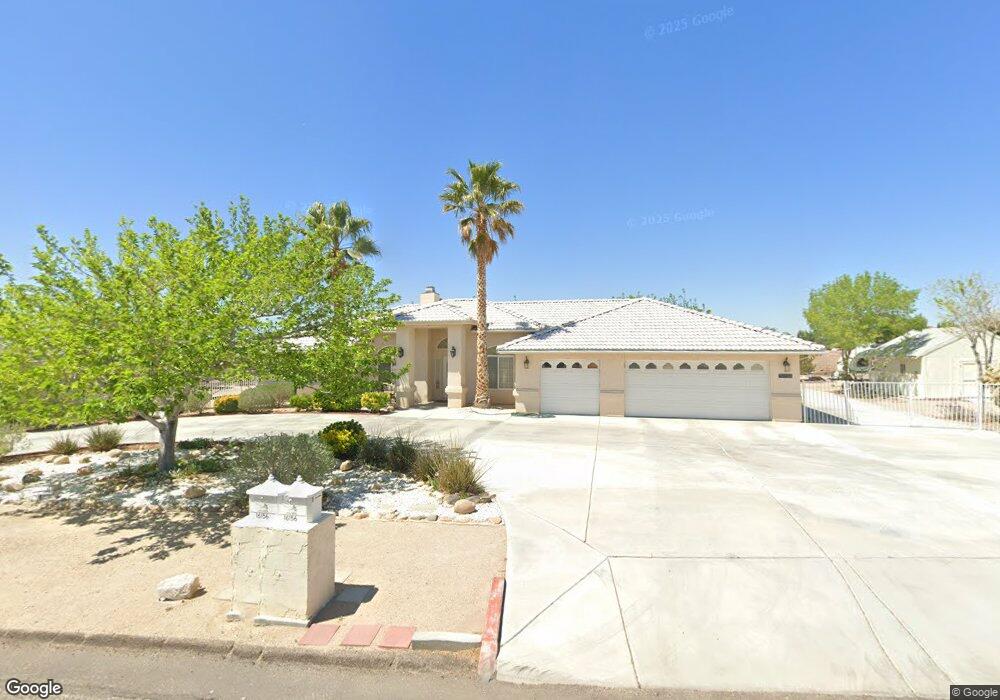
16156 Menahka Rd Apple Valley, CA 92307
High Desert NeighborhoodEstimated Value: $492,722 - $553,000
3
Beds
2
Baths
2,270
Sq Ft
$236/Sq Ft
Est. Value
About This Home
This home is located at 16156 Menahka Rd, Apple Valley, CA 92307 and is currently estimated at $534,931, approximately $235 per square foot. 16156 Menahka Rd is a home located in San Bernardino County with nearby schools including Desert Knolls Elementary School, Granite Hills High School, and Academy for Academic Excellence.
Ownership History
Date
Name
Owned For
Owner Type
Purchase Details
Closed on
Aug 3, 2019
Sold by
Richey Robert H and Richey Rickey Joanne
Bought by
Richey Robert H and Richey Joanne
Current Estimated Value
Purchase Details
Closed on
Sep 9, 2002
Sold by
Carmody Virginia R and Carmody Revocable S Virginia R
Bought by
Richey Jason C and Richey Haley M
Purchase Details
Closed on
Oct 1, 2001
Sold by
Keen Macon R and Keen Janice A
Bought by
Richey Robert H and Richey Joanne
Home Financials for this Owner
Home Financials are based on the most recent Mortgage that was taken out on this home.
Original Mortgage
$144,000
Interest Rate
6.87%
Purchase Details
Closed on
Sep 30, 2000
Sold by
Barsoum Amin K
Bought by
Keen Macon R and Keen Janice A
Create a Home Valuation Report for This Property
The Home Valuation Report is an in-depth analysis detailing your home's value as well as a comparison with similar homes in the area
Home Values in the Area
Average Home Value in this Area
Purchase History
| Date | Buyer | Sale Price | Title Company |
|---|---|---|---|
| Richey Robert H | -- | None Available | |
| Richey Jason C | $47,000 | Commonwealth Title | |
| Richey Robert H | $180,000 | First American Title Ins Co | |
| Keen Macon R | $42,000 | First American Title Ins Co | |
| Barsoum Amin K | -- | First American Title Ins Co |
Source: Public Records
Mortgage History
| Date | Status | Borrower | Loan Amount |
|---|---|---|---|
| Previous Owner | Richey Robert H | $144,000 |
Source: Public Records
Tax History Compared to Growth
Tax History
| Year | Tax Paid | Tax Assessment Tax Assessment Total Assessment is a certain percentage of the fair market value that is determined by local assessors to be the total taxable value of land and additions on the property. | Land | Improvement |
|---|---|---|---|---|
| 2025 | $2,986 | $265,915 | $62,047 | $203,868 |
| 2024 | $2,986 | $260,701 | $60,830 | $199,871 |
| 2023 | $2,957 | $255,589 | $59,637 | $195,952 |
| 2022 | $2,911 | $250,578 | $58,468 | $192,110 |
| 2021 | $2,843 | $245,665 | $57,322 | $188,343 |
| 2020 | $2,808 | $243,146 | $56,734 | $186,412 |
| 2019 | $2,755 | $238,379 | $55,622 | $182,757 |
| 2018 | $2,686 | $233,705 | $54,531 | $179,174 |
| 2017 | $2,648 | $229,123 | $53,462 | $175,661 |
| 2016 | $2,543 | $224,631 | $52,414 | $172,217 |
| 2015 | $2,504 | $221,257 | $51,627 | $169,630 |
| 2014 | $2,470 | $216,923 | $50,616 | $166,307 |
Source: Public Records
Map
Nearby Homes
- 0 Kamana Ct Unit HD25079746
- 0 Kasota Rd Unit HD25183847
- 0 Kamana Rd
- 123 Menahka Rd Unit 638
- 47339211 Kokanee Rd
- 16385 Kamana Ct
- 16501 Menahka Rd
- 0 Muni Rd Unit HD24234033
- 16465 Koda Rd
- 0 Munsee Rd
- 0 Menahka Ct
- 0 Viho Rd
- 16247 Viho Rd
- 18765 Munsee Rd
- 0 Tuscola Rd Unit HD25200058
- 0 Tuscola Rd Unit HD25118626
- 16601 Kasota Rd
- 16457 Viho Rd
- 18668 Kamana Rd
- 18425 Owatonna Rd
- 16153 Menahka Rd
- 16182 Menahka Rd
- 18408 Siskiyou Rd
- 16183 Olalee Rd
- 16182 Olalee Rd
- 16202 Menahka Rd
- 16183 Siskiyou Ct
- 16215 Menahka Rd
- 16169 Siskiyou Ct
- 16191 Olalee Rd
- 16204 Olalee Rd
- 16216 Menahka Rd
- 16143 Siskiyou Ct
- 18520 Siskiyou Rd
- 16193 Siskiyou Ct
- 16233 Menahka Rd
- 16205 Olalee Rd
- 18525 Siskiyou Rd
- 16224 Olalee Rd
- 16232 Menahka Rd