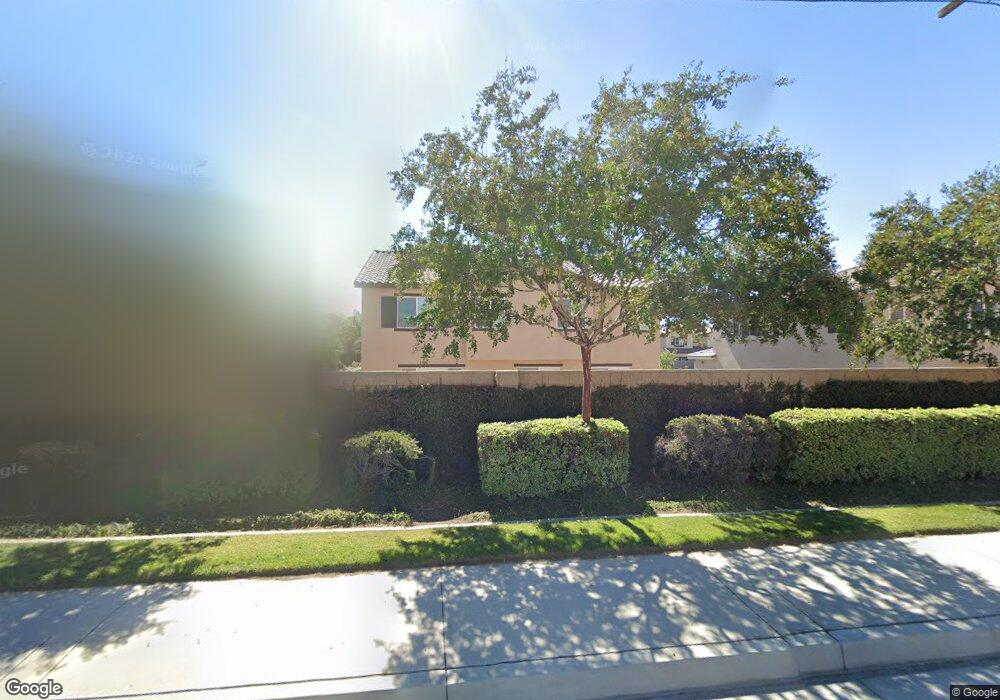
16156 Twinberry Ct Fontana, CA 92336
Estimated Value: $764,726 - $815,000
4
Beds
3
Baths
2,811
Sq Ft
$279/Sq Ft
Est. Value
About This Home
This home is located at 16156 Twinberry Ct, Fontana, CA 92336 and is currently estimated at $784,432, approximately $279 per square foot. 16156 Twinberry Ct is a home with nearby schools including Kathy Binks Elementary School, Wayne Ruble Middle School, and Fontana A. B. Miller High School.
Ownership History
Date
Name
Owned For
Owner Type
Purchase Details
Closed on
Mar 8, 2021
Sold by
Rsi Communities California Llc
Bought by
Perez Carlos and Buenrostro Janet
Current Estimated Value
Home Financials for this Owner
Home Financials are based on the most recent Mortgage that was taken out on this home.
Original Mortgage
$508,246
Interest Rate
3.05%
Mortgage Type
New Conventional
Purchase Details
Closed on
Jul 23, 2020
Sold by
Project Royal Lp
Bought by
Rsi Communities California Llc
Purchase Details
Closed on
Mar 9, 2018
Sold by
Rsi Communities California Llc
Bought by
Project Royal Lp
Purchase Details
Closed on
Dec 7, 2017
Sold by
Stratham Summit Inc
Bought by
Rsi Communities California Llc
Purchase Details
Closed on
May 17, 2010
Sold by
Pak Hooshang and Pak Maryam
Bought by
Stratham Summit Inc
Create a Home Valuation Report for This Property
The Home Valuation Report is an in-depth analysis detailing your home's value as well as a comparison with similar homes in the area
Home Values in the Area
Average Home Value in this Area
Purchase History
| Date | Buyer | Sale Price | Title Company |
|---|---|---|---|
| Perez Carlos | $535,000 | First American Title Company | |
| Rsi Communities California Llc | $510,500 | First American Title Company | |
| Project Royal Lp | $18,384,000 | First American Title Company | |
| Project Royal Lp | $18,384,000 | First American Title Company | |
| Rsi Communities California Llc | $1,468,500 | First American Title Company | |
| Stratham Summit Inc | -- | First American Title Company |
Source: Public Records
Mortgage History
| Date | Status | Borrower | Loan Amount |
|---|---|---|---|
| Previous Owner | Perez Carlos | $508,246 |
Source: Public Records
Tax History Compared to Growth
Tax History
| Year | Tax Paid | Tax Assessment Tax Assessment Total Assessment is a certain percentage of the fair market value that is determined by local assessors to be the total taxable value of land and additions on the property. | Land | Improvement |
|---|---|---|---|---|
| 2025 | $10,722 | $579,097 | $194,837 | $384,260 |
| 2024 | $10,722 | $567,742 | $191,017 | $376,725 |
| 2023 | $10,016 | $556,610 | $187,272 | $369,338 |
| 2022 | $9,990 | $545,696 | $183,600 | $362,096 |
| 2021 | $5,993 | $170,141 | $170,141 | $0 |
| 2020 | $5,680 | $185,692 | $185,692 | $0 |
| 2019 | $5,721 | $182,051 | $182,051 | $0 |
| 2018 | $5,524 | $163,144 | $163,144 | $0 |
| 2017 | $4,511 | $75,634 | $55,612 | $20,022 |
| 2016 | $4,443 | $74,151 | $54,522 | $19,629 |
| 2015 | $4,379 | $73,037 | $53,703 | $19,334 |
| 2014 | $4,327 | $71,606 | $52,651 | $18,955 |
Source: Public Records
Map
Nearby Homes
- 16212 Star Crest Way
- 16004 Cascade Dr
- 16183 Lumia Way
- 16201 Lumia Way
- 16179 Lumia Way
- 16175 Lumia Way
- 16195 Lumia Way
- Residence 1602 Plan at Citrus Lane
- Residence 1500 Plan at Citrus Lane
- 7155 Citrus Ave Unit 411
- 7155 Citrus Ave Unit 433
- 16168 Lumia Way
- 15931 Los Cedros Ave
- 16001 Chase Rd Unit 96
- 7055 Springtime Ave
- 7140 Melody Dr
- 16738 Petrus Ln
- 16040 Jamie Ln Unit 9
- 16040 Jamie Ln Unit 8
- 16040 Parkhouse Dr Unit 1
- 16174 Twinberry Ct
- 6919 Winter Night Ave
- 6909 Winter Night Ave
- 16175 Twinberry Ct
- 16165 Twinberry Ct
- 16166 Twinberry Ct
- 6939 Winter Night Ave
- 16185 Twinberry Ct
- 16120 Twinberry Ct
- 16119 Twinberry Ct
- 6952 Winter Night Ave
- 6953 Winter Night Ave
- 16155 Twinberry Ct
- 16146 Twinberry Ct
- 6964 Winter Night Ave
- 6965 Winter Night Ave
- 16145 Twinberry Ct
- 16210 Carmine St
- 16158 Carmine St
- 6881 White Fig Ln