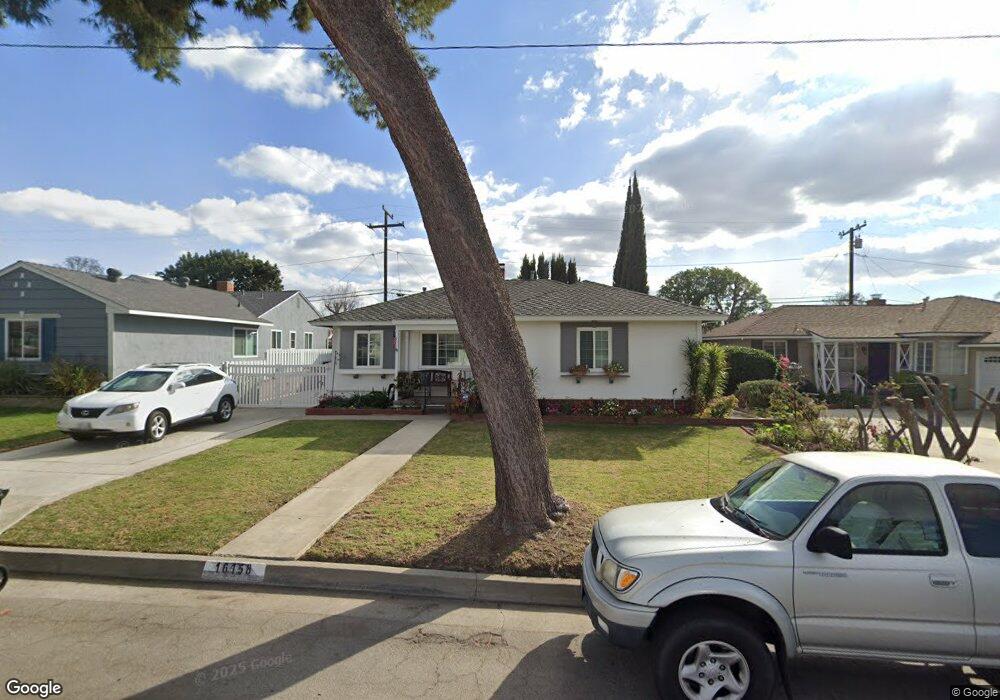
16158 Leffco Rd Whittier, CA 90603
South Whittier NeighborhoodEstimated Value: $798,994 - $877,000
2
Beds
2
Baths
1,323
Sq Ft
$633/Sq Ft
Est. Value
About This Home
This home is located at 16158 Leffco Rd, Whittier, CA 90603 and is currently estimated at $837,249, approximately $632 per square foot. 16158 Leffco Rd is a home located in Los Angeles County with nearby schools including Leffingwell Elementary School, Granada Middle School, and La Serna High School.
Ownership History
Date
Name
Owned For
Owner Type
Purchase Details
Closed on
Jul 30, 2013
Sold by
Kelley David and Kelley Debby
Bought by
Kelley David and Kelley Debra
Current Estimated Value
Purchase Details
Closed on
Sep 1, 2011
Sold by
Kelley David and Kelley Debby
Bought by
Kelley Debra and Kelley David
Home Financials for this Owner
Home Financials are based on the most recent Mortgage that was taken out on this home.
Original Mortgage
$227,821
Outstanding Balance
$20,388
Interest Rate
4.48%
Mortgage Type
New Conventional
Estimated Equity
$816,861
Purchase Details
Closed on
Jul 10, 2009
Sold by
Kelley David M and Kelley Debra
Bought by
Kelley David and Kelley Debby
Purchase Details
Closed on
Feb 26, 2002
Sold by
Kelley David M and Kelley Debra
Bought by
Kelley Debra
Home Financials for this Owner
Home Financials are based on the most recent Mortgage that was taken out on this home.
Original Mortgage
$150,000
Interest Rate
6.8%
Create a Home Valuation Report for This Property
The Home Valuation Report is an in-depth analysis detailing your home's value as well as a comparison with similar homes in the area
Home Values in the Area
Average Home Value in this Area
Purchase History
We collect this data history from publicly available records. To have your information removed, we recommend requesting removal directly through your county’s website.
| Date | Buyer | Sale Price | Title Company |
|---|---|---|---|
| Kelley David | -- | None Available | |
| Kelley Debra | -- | Orange Coast Title Company | |
| Kelley David | -- | Accommodation | |
| Kelley Debra | -- | Southland Title |
Source: Public Records
Mortgage History
We collect this data history from publicly available records. To have your information removed, we recommend requesting removal directly through your county’s website.
| Date | Status | Borrower | Loan Amount |
|---|---|---|---|
| Open | Kelley Debra | $227,821 | |
| Previous Owner | Kelley Debra | $150,000 |
Source: Public Records
Tax History
| Year | Tax Paid | Tax Assessment Tax Assessment Total Assessment is a certain percentage of the fair market value that is determined by local assessors to be the total taxable value of land and additions on the property. | Land | Improvement |
|---|---|---|---|---|
| 2025 | $4,461 | $311,189 | $198,742 | $112,447 |
| 2024 | $4,119 | $305,089 | $194,846 | $110,243 |
| 2023 | $4,132 | $299,108 | $191,026 | $108,082 |
| 2022 | $4,003 | $293,244 | $187,281 | $105,963 |
| 2021 | $3,852 | $287,495 | $183,609 | $103,886 |
| 2019 | $3,766 | $278,969 | $178,164 | $100,805 |
| 2018 | $3,575 | $273,500 | $174,671 | $98,829 |
| 2016 | $3,375 | $262,883 | $167,890 | $94,993 |
| 2015 | $3,397 | $258,936 | $165,369 | $93,567 |
| 2014 | -- | $253,865 | $162,130 | $91,735 |
Source: Public Records
Map
Nearby Homes
- 16109 Gables Loop
- 10813 1st Ave
- 10418 Bogardus Ave
- 10947 Groveland Ave
- 10162 Grovedale Dr
- 10122 Groveside Ave
- 11003 Lindesmith Ave
- 16540 Whittier Blvd
- 16540 Whittier Blvd Unit 6
- 16540 Whittier Blvd Unit 2
- 10339 Maybrook Ave
- 15712 Lambert Rd
- 16432 Whittier Blvd Unit 2
- 11339 1st Ave
- 11514 Mollyknoll Ave
- 351 Kinley St
- 15373 Ashley Ct
- 15844 Garydale Dr
- 15845 Sharonhill Dr
- 1320 Roanoke St
- 16152 Leffco Rd
- 16133 Citrustree Rd
- 16170 Leffco Rd
- 16120 Leffco Rd
- 16139 Citrustree Rd
- 16127 Citrustree Rd
- 16151 Sunny Ct
- 16145 Citrustree Rd
- 16121 Citrustree Rd
- 16114 Leffco Rd
- 16176 Leffco Rd
- 16167 Leffco Rd
- 16145 Sunny Ct
- 16115 Citrustree Rd
- 16151 Citrustree Rd
- 16125 Sunny Ct
- 16171 Leffco Rd
- 16108 Leffco Rd
- 16182 Leffco Rd
- 16177 Leffco Rd
Your Personal Tour Guide
Ask me questions while you tour the home.